Skip to content
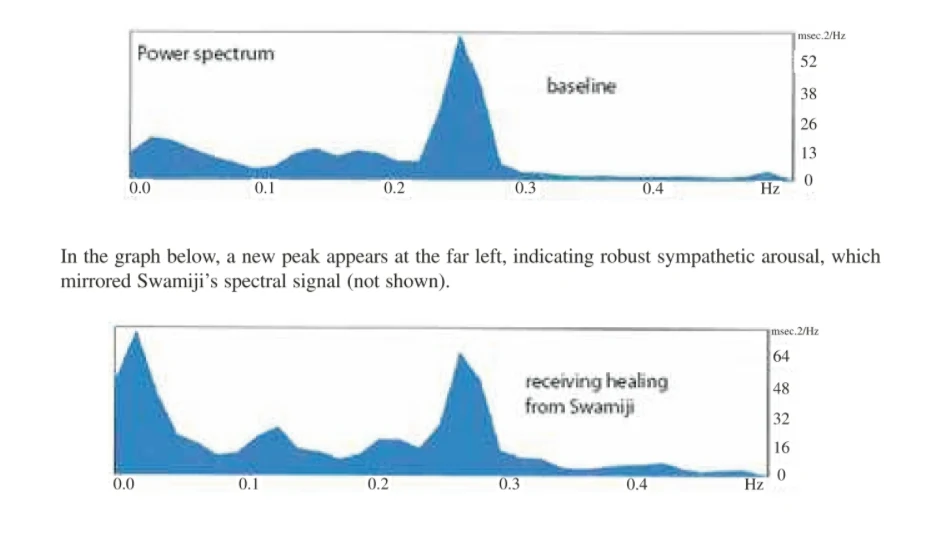
A scientific figure with two blue filled power-spectrum graphs on a white background. The upper graph, labelled "Power spectrum" and "baseline", shows a tall peak near 0.25 Hz with smaller bumps at low frequencies. The lower graph, labelled "receiving healing from Swamiji", shows a large peak at the far left near 0.0 Hz and a second peak near 0.26 Hz. Both axes are labelled msec.2/Hz and Hz. The figure accompanies a caption about heart rate variability recorded during healing, and a caption above it describes Ann Trechak recording the baseline. No people are visible.