Skip to content
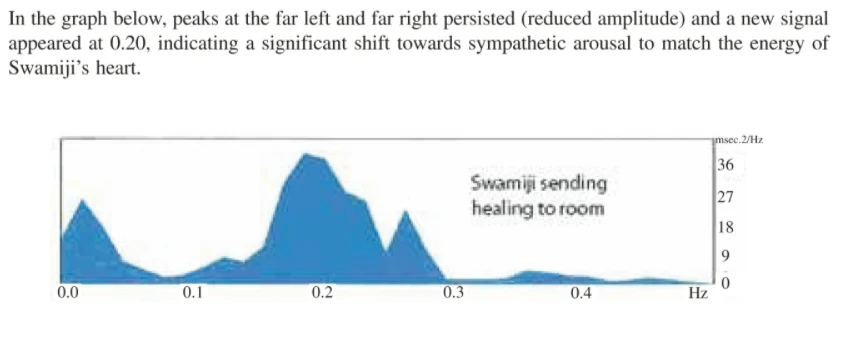
Scientific-style graph on a white page, titled in the article heading about heart rate variability research. A blue filled power spectrum plot shows frequency in Hz along the horizontal axis from 0.0 to 0.4 and power in msec.2/Hz on the vertical axis from 0 to 36. Peaks appear at the far left and far right with reduced amplitude, and a prominent new peak rises near 0.20 Hz. The plot is labelled Swamiji sending healing to room. Above the graph is body text describing the measurements. No people are visible.