Skip to content
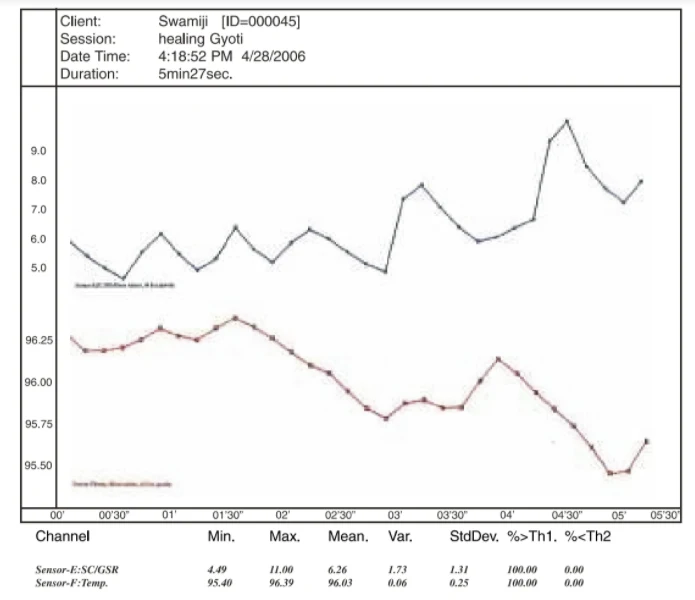
A scanned printed chart titled as a session record, showing a biofeedback-style graph with two line plots over a five-and-a-half-minute timeline. Header fields list Client: Swamiji [ID-000045], Session: healing Gyoti, Date Time: 4:18:52 PM 4/28/2006, Duration: 5min27sec. The upper black line tracks values roughly between 5 and 9, the lower red line tracks values near 95.5 to 96.4, with a data table beneath listing channels Sensor-E:SC/GSR and Sensor-F:Temp with min, max, mean, variance and standard deviation columns. No people are shown.