Skip to content
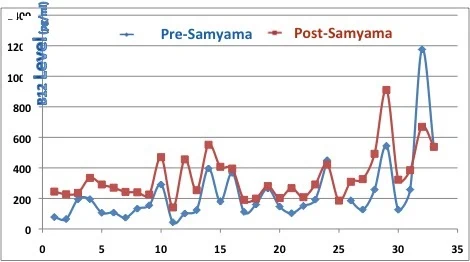
A line chart graphic titled with a B12 Level axis in pg/ml, plotting Pre-Samyama blue line with diamond markers against Post-Samyama red line with square markers across 33 numbered participant points on the horizontal axis. The red post-samyama values are mostly higher than the blue pre-samyama values, with a large spike near point 29 and a peak near point 33 on the blue line. No people are shown; this is a research data graphic.
Photo 234 of 243 from 10 October 2012