Skip to content
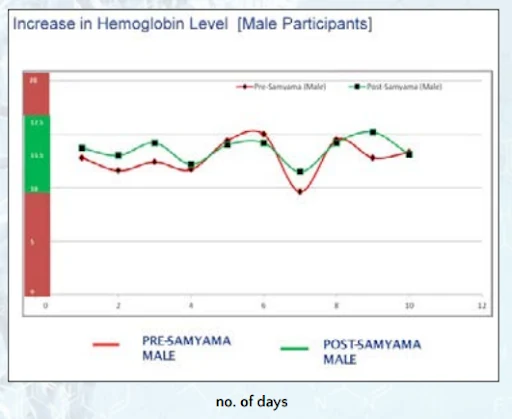
A line graph titled "Increase in Hemoglobin Level [Male Participants]" plots pre-Samyama (red line) and post-Samyama (green line) hemoglobin values across ten days on the horizontal axis labelled "no. of days", against a vertical scale with a red and green shaded band. A legend below the chart reads PRE-SAMYAMA MALE and POST-SAMYAMA MALE. The graph is set against a light blue and white background with a faint floral pattern, and no physical people are visible.
Photo 235 of 243 from 10 October 2012