Skip to content
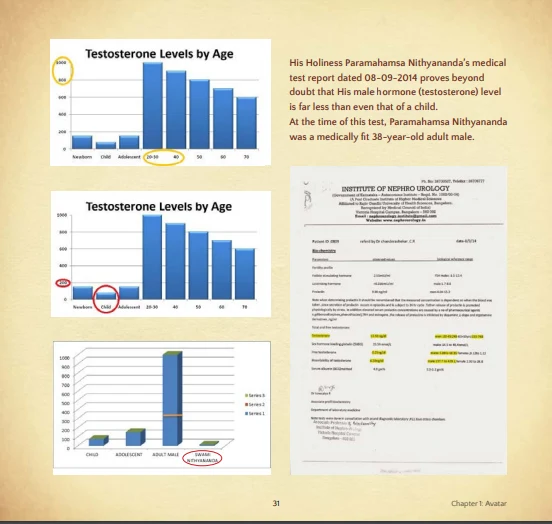
A slide-style graphic with three panels about testosterone levels. Two bar charts titled "Testosterone Levels by Age" show bars for Newborn, Child, Adolescent, 20-30, 40, 50, 60, 70, with yellow and red circles highlighting the child and adult bars. A third bar chart compares Child, Adolescent, Adult Male and a bar labelled Swami Nithyananda, with a red circle around the last bar. At right, a hospital-style lab report page from Institute of Nephro Urology lists hormone results with highlighted rows. Pages include a numbered footer reading 31 and Chapter 1: Avatar. No physical people are shown.
Photo 7 of 7 from 13 June 2011