Skip to content
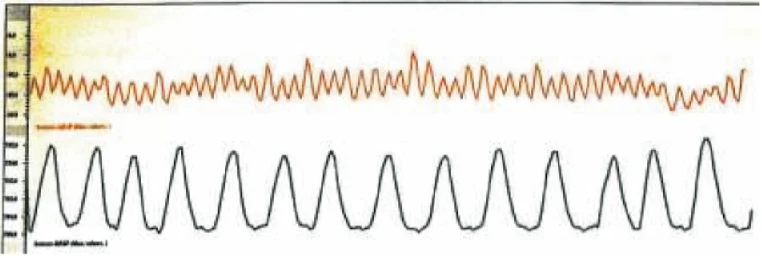
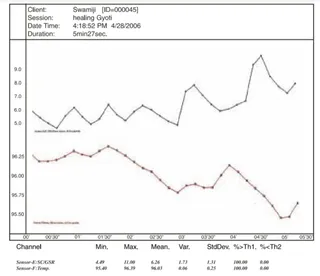
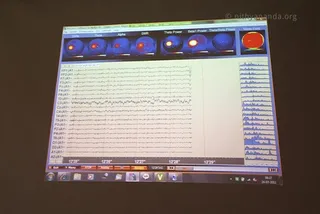
Scientific chart from a research document titled EEG Research on Breathing and Heart Rate Rhythm. Two stacked waveform traces are plotted on a white background with a yellowish top-left corner: an upper orange, jagged trace representing blood volume pulse and a lower black trace with large, evenly spaced peaks representing breathing, about thirteen cycles per minute. No people are physically present; the image is a graph of recorded physiological signals with small printed labels along the left axis and under the traces.