Skip to content
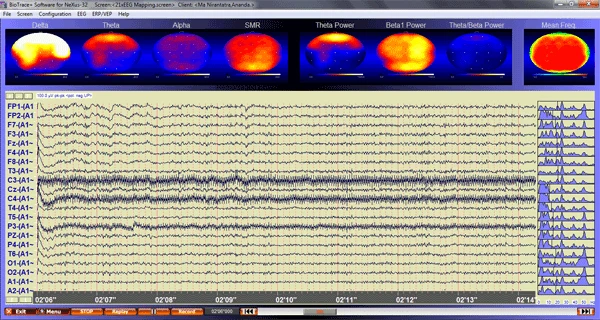
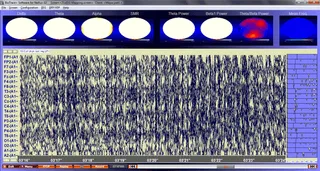
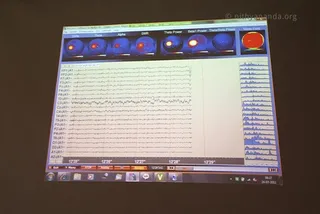
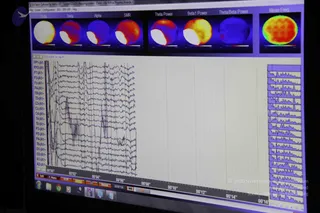
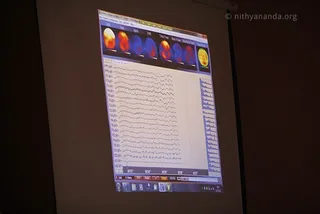
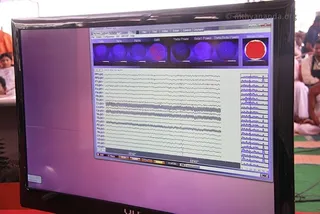
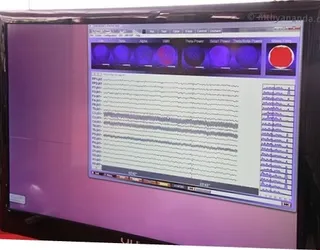
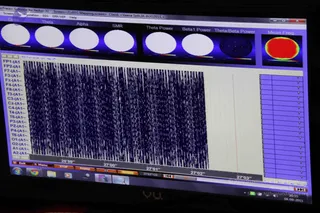
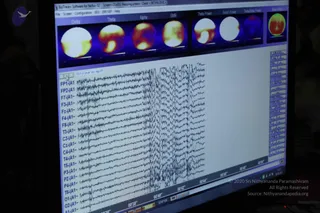
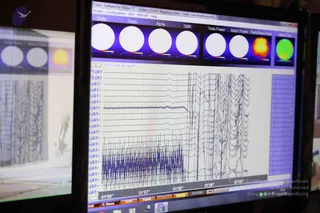
Screenshot of BioTrace+ EEG software (NeXus-32) showing brain-activity recordings from a kundalini research session. Top row shows colour topographic brain maps labelled Delta, Theta, Alpha and SMR, then Theta Power, Beta1 Power, Theta/Beta Power and Mean Freq., with warm red and yellow areas over blue backgrounds. Below is a dense band of wavy multi-channel EEG traces on a cream background, labelled FP1-A1 through A2-A1, with a time axis from 02:08 to 02:14 and blue spectral bars at the right edge. Menu bar and bottom toolbar buttons are visible.
Photo 1080 of 1111 from 15 July 2011