Skip to content
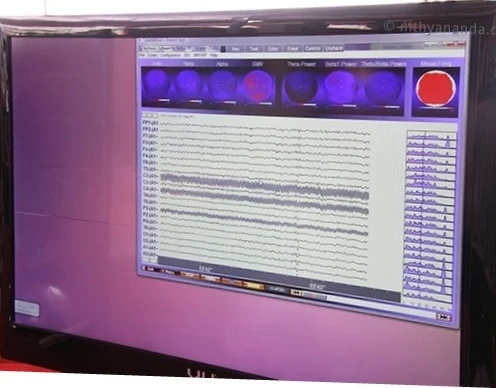
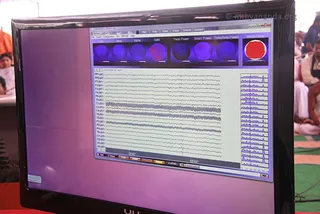
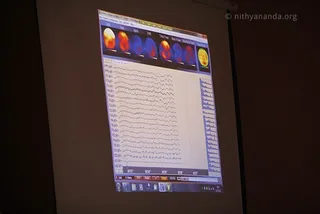
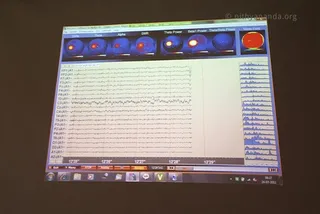
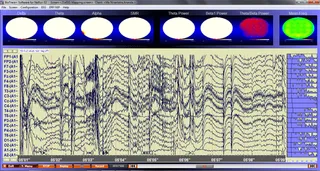
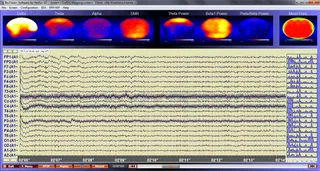
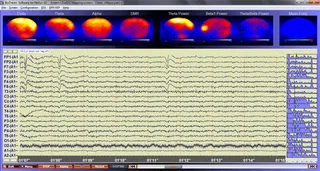
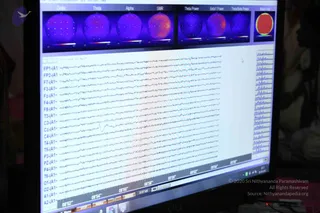
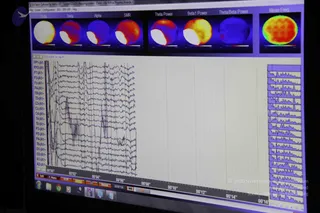
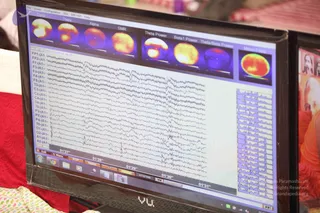
A flat-screen monitor displays an EEG brainwave recording software interface with a purple-tinted screen. Coloured circular topographic brain maps appear across the top labelled with bands such as Delta, Alpha, Theta, Beta and Theta/Delta Power, above rows of wavy multi-channel EEG traces and a column of small power spectrum graphs on the right. The monitor sits in a room with a red object at its lower edge. No people are visible, and no a person candidate appears in the scene.