Skip to content
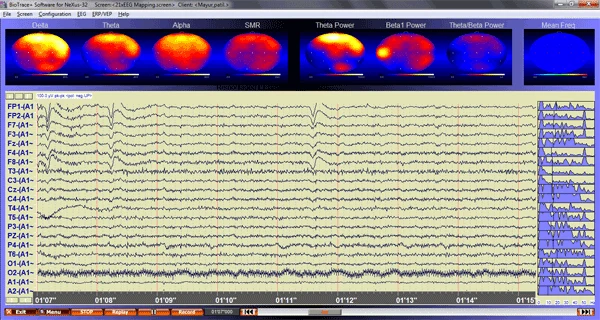
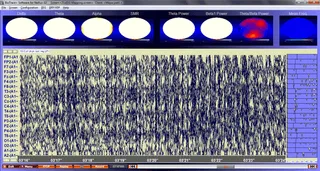
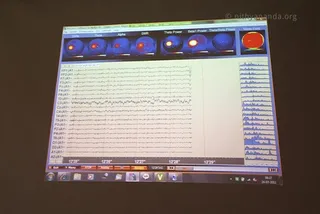
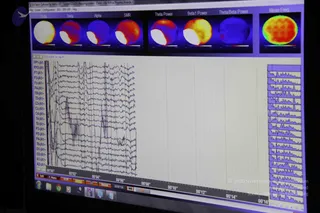
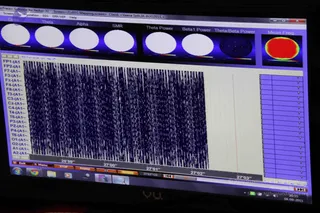
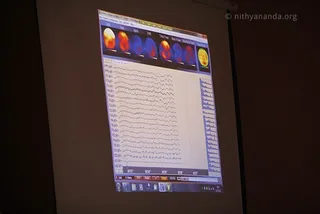
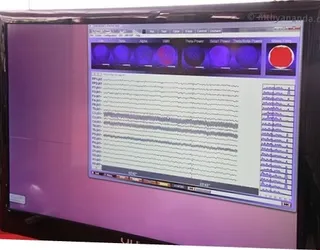
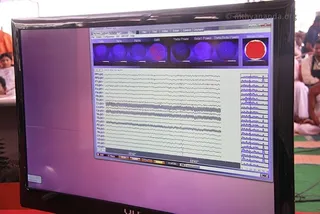
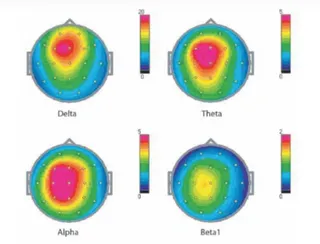
Screenshot of BioTrace+ software for NeXus-32 showing EEG brain-mapping results. The top row displays colourful heat-map topographic brain images labelled Delta, Theta, Alpha, SMR, Theta Power, Beta1 Power, Theta/Beta Power and Mean Freq, with red and yellow areas indicating high activity. Below, a dark-blue panel holds a multi-channel EEG waveform trace in white and black lines across channels such as FP1-A1, F7-A1, T3-A1, O2-A1, with a time axis from 01'07" to 01'15" and a menu bar at the top. No people are visible.
Photo 1082 of 1111 from 15 July 2011