Skip to content
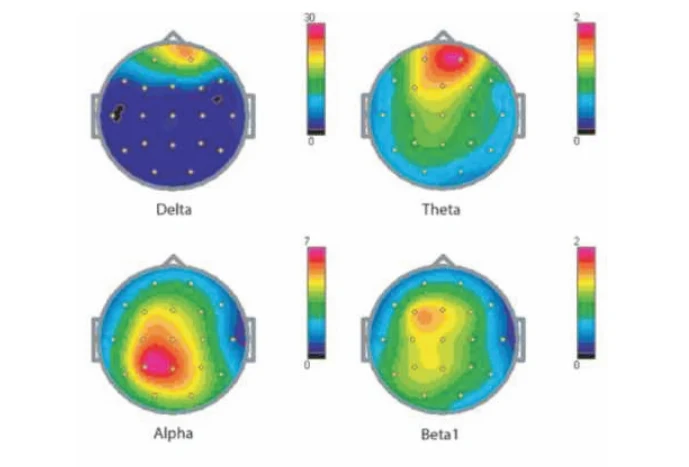
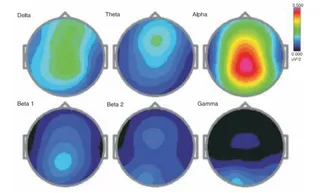
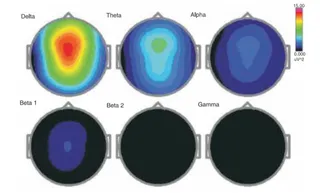
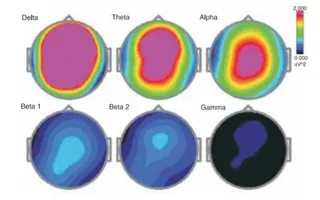
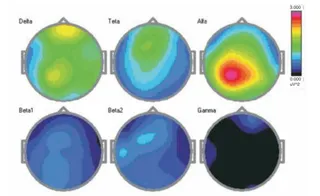
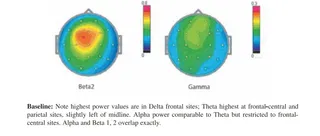
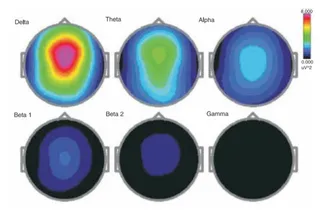
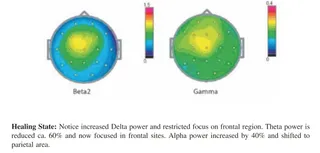
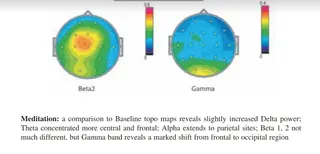
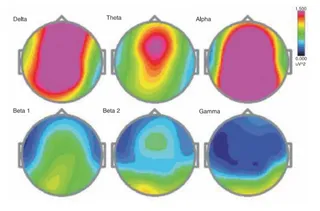
A scientific graphic showing four colour-coded EEG topographic brain maps arranged in a two-by-two grid, each labelled with a brainwave band: Delta, Theta, Alpha and Beta1. Each head outline shows electrode points and a colour scale from blue (low) through green and yellow to red (high) for average power values. The Delta map is mostly blue with a red-orange area at the top front, Theta shows a red spot at the upper front, Alpha shows a strong red and yellow peak at the centre-left, and Beta1 shows a yellow and red area at the upper centre. No people are visible.
Photo 31 of 32 from 17 June 2005