Skip to content
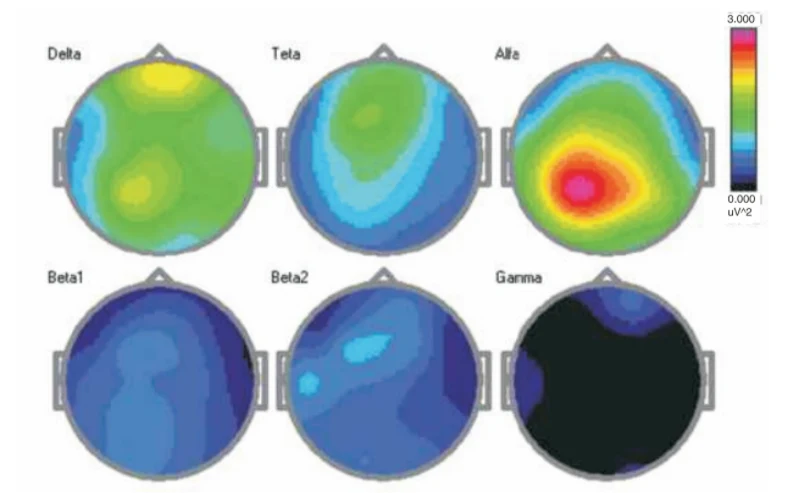
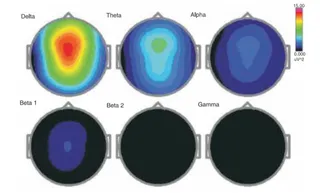
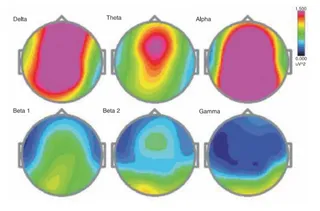
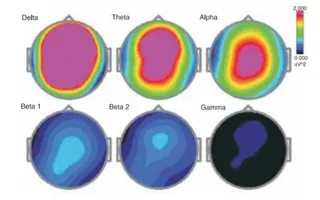
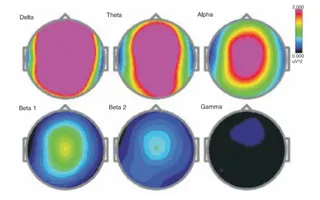
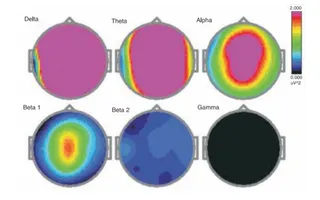
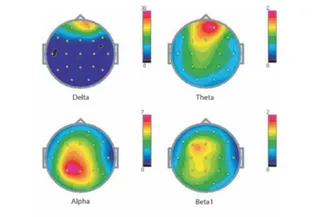
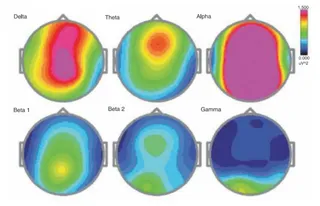
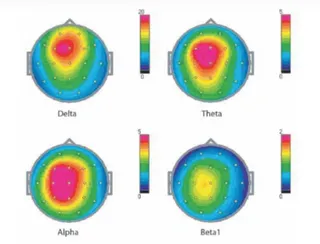
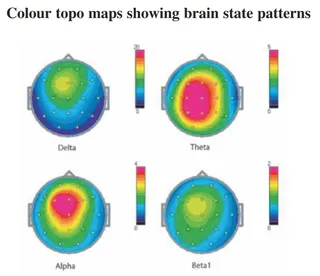
A scientific graphic showing six circular topographic brain maps arranged in two rows, labelled Delta, Teta, Alfa, Beta1, Beta2 and Gamma. Each map is a head-outline plot shaded by power from blue (low) to red (high) on a colour scale, with the strongest red-pink alpha activity concentrated over the central and posterior regions in the Alfa map. No physical people are shown; the figure illustrates EEG band power distribution from a research document on brainstate patterns.