Skip to content
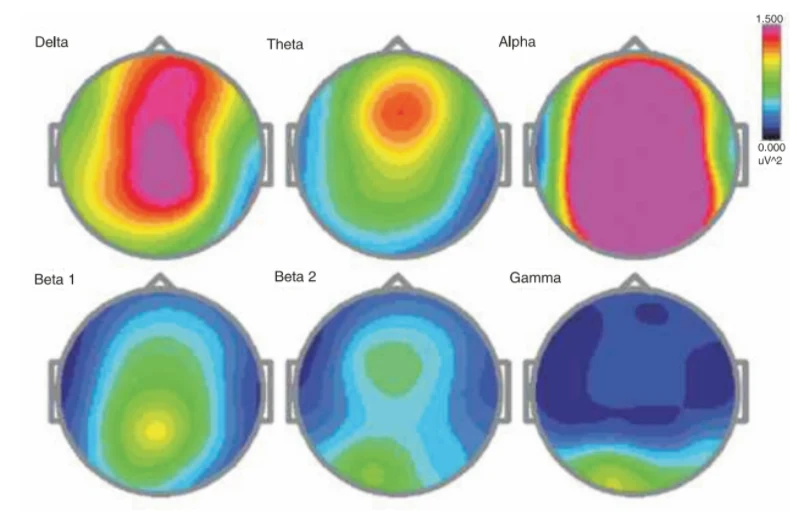
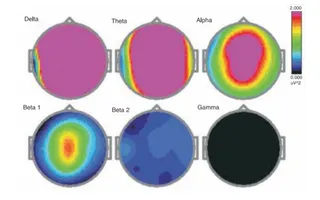
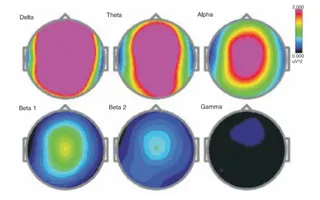
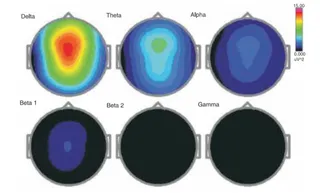
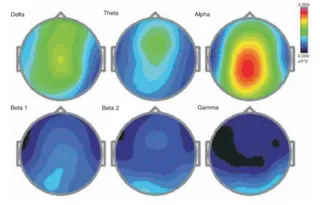
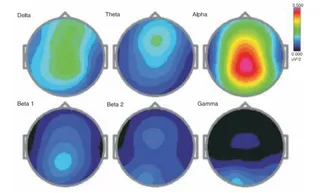
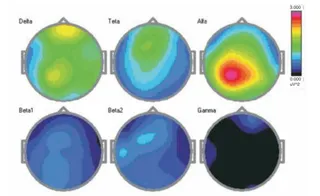
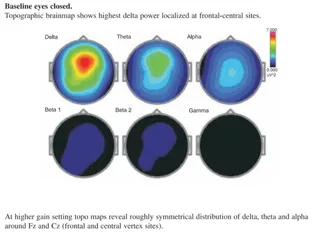
A scientific graphic showing six EEG topographic brain maps arranged in two rows of three, labelled Delta, Theta, Alpha, Beta 1, Beta 2 and Gamma. Each circular head outline is coloured by band power, using a colour scale from black at 0.000 to magenta at 1.500 uV^2. The Alpha map is almost uniformly magenta across the whole head, indicating dominant alpha activity, while the Delta map shows high power in central and occipital areas, Theta shows a focal red area toward the front, and Beta and Gamma maps are mostly blue and green with low power. The image contains no people.