Skip to content
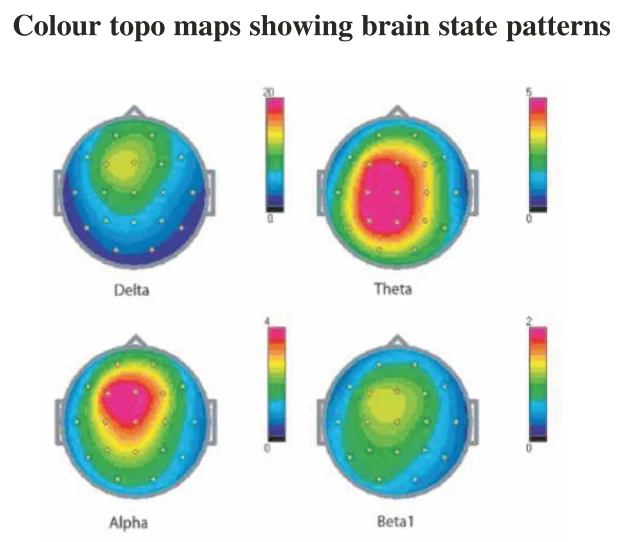
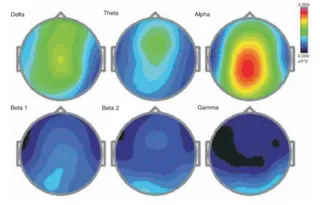
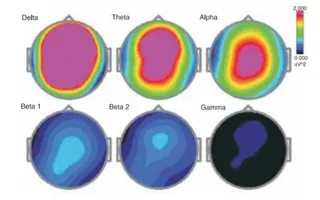
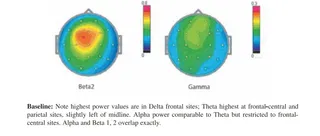
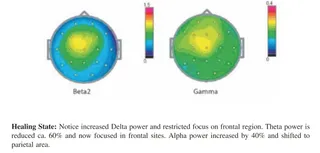
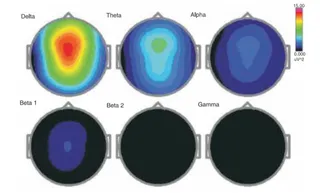
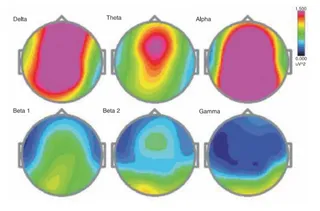
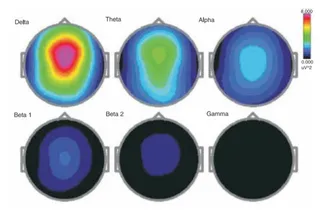
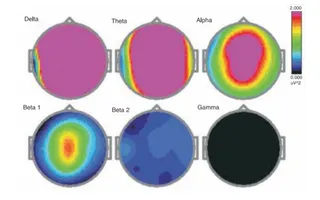
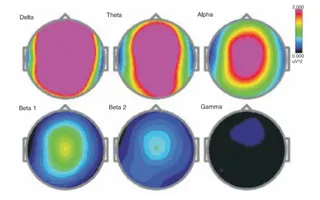
A scanned page from a research article titled "Colour topo maps showing brain state patterns". It shows four colour-coded EEG topographic head maps arranged in a 2x2 grid, labelled Delta, Theta, Alpha and Beta1, each with a vertical colour scale bar. The head outlines have small electrode dots, with warm red and pink regions indicating the highest average power values and blue and green regions lower values. No people are pictured.
Photo 28 of 32 from 17 June 2005