Skip to content
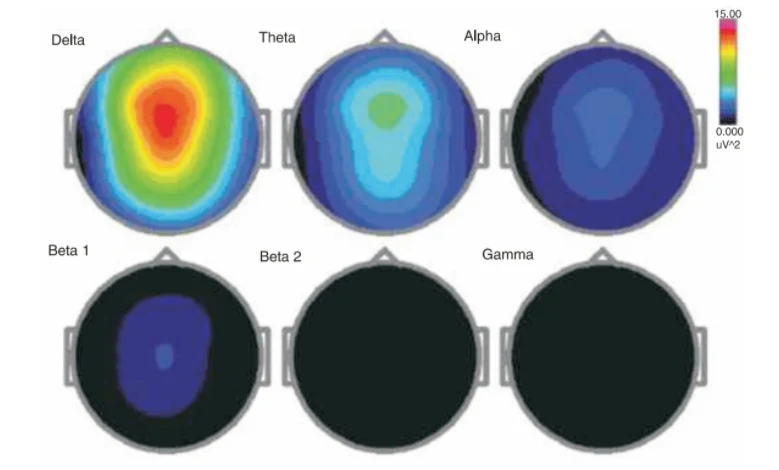
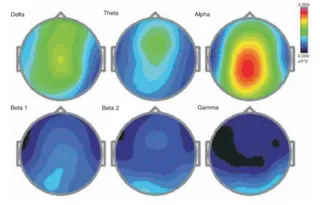
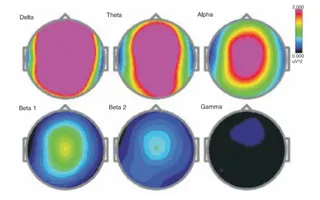
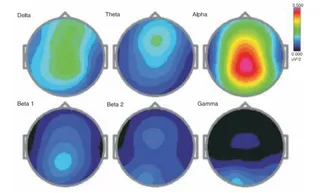
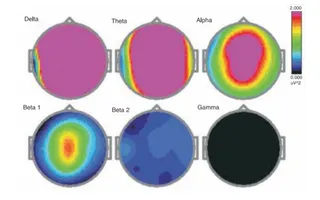
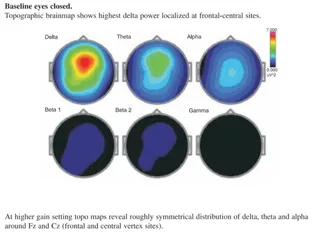
A scientific graphic showing six EEG topographic brain maps arranged in a two-row grid, labelled Delta, Theta, Alpha, Beta 1, Beta 2 and Gamma. Each circular head outline is shaded by band power, with a colour scale bar at upper right running from 0.000 to 15.00 uV^2 through blue, green, yellow, orange and red. The Delta map shows a strong red and orange central-to-frontal peak, while Theta shows a green central spot, Alpha shows dim blue, Beta 1 shows a small faint blue patch, and Beta 2 and Gamma are essentially black. No people appear in the image.