Skip to content
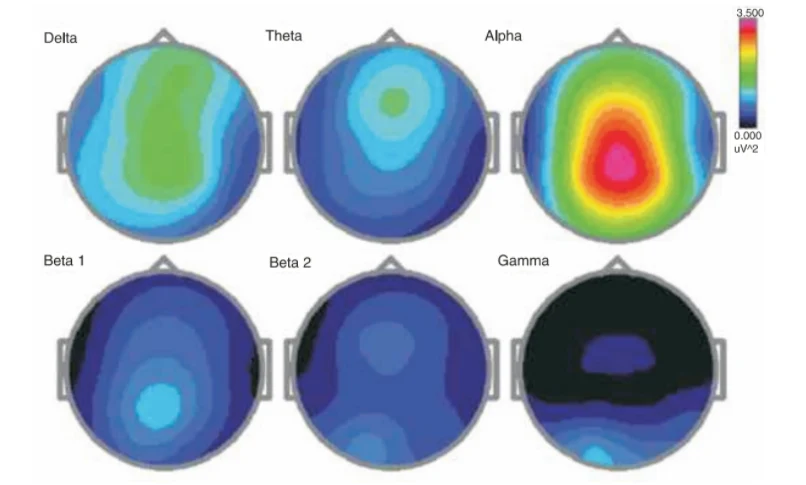
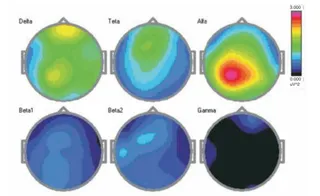
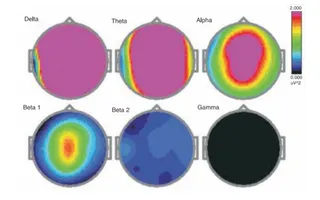
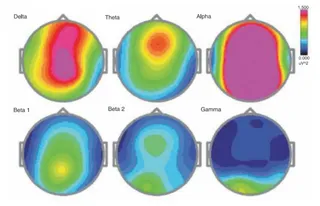
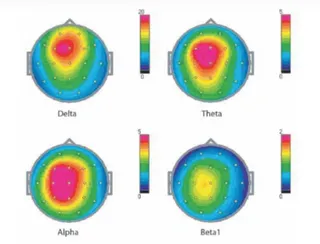
A scientific graphic of six EEG topographic brain maps arranged in two rows of three, labelled Delta, Theta, Alpha, Beta 1, Beta 2 and Gamma, shown as top-down head outlines with ear and nose markers. Colour scales run from dark blue (low) through green and yellow to red (high), with a colour bar reading 0.000 to 3.500 uV^2. The Alpha map shows a strong red-yellow peak at the centre, indicating dominant alpha power, while the other bands appear low in blue and dark tones. No physical people are shown.