Skip to content
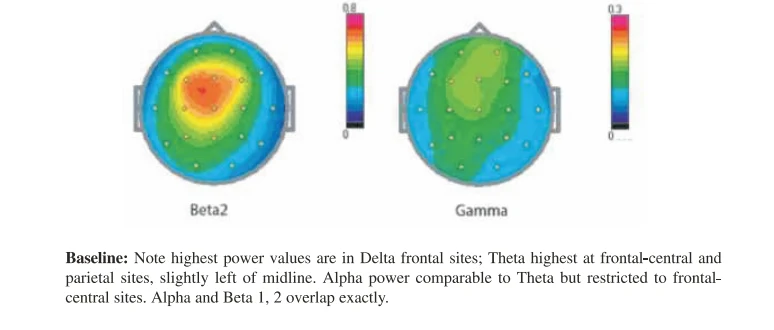
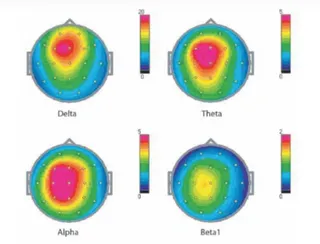
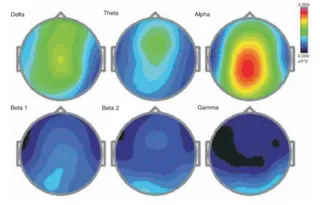
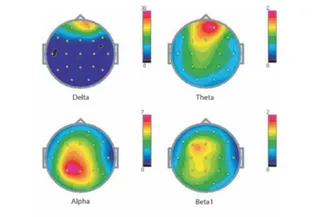
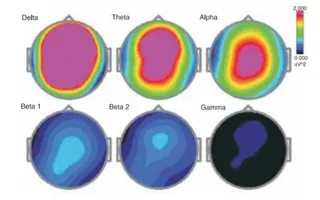
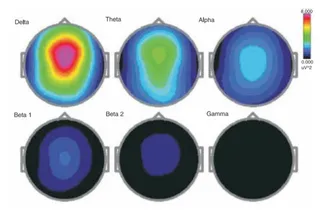
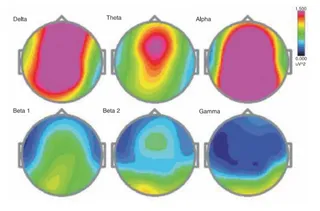
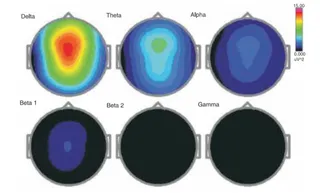
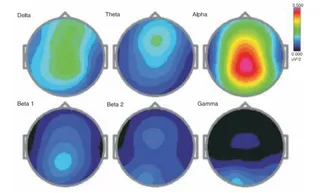
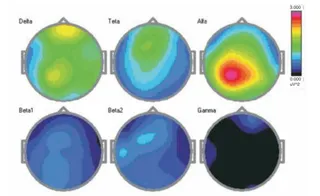
Scientific figure from a research article showing two colored topographic brain maps drawn on outline head diagrams with small electrode dots. The left map labelled Beta2 has a red and orange hotspot at frontal-central sites, and the right map labelled Gamma is mostly green with a lighter band and blue edges. A colour scale bar sits beside each map, and a caption beneath explains the Baseline state power values for the Delta, Theta and Alpha bands. No people are shown.
Photo 29 of 32 from 17 June 2005