Skip to content
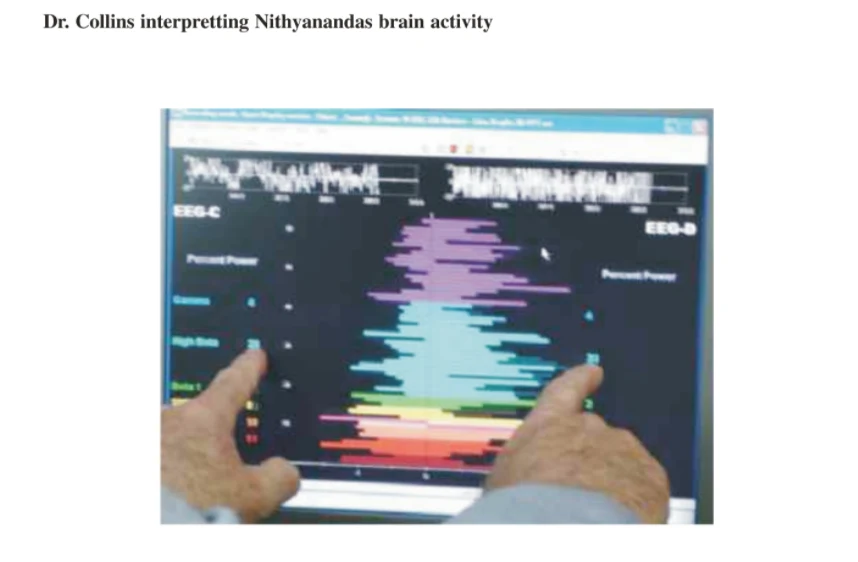
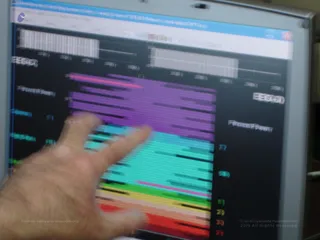
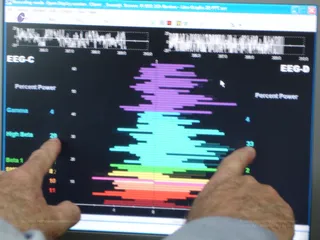
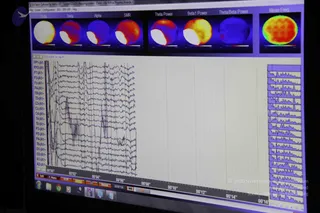
A photograph of a computer monitor displaying colourful EEG brain-wave graphs with horizontal bars in purple, cyan, green, yellow, orange and red, labelled EEG-C and EEG-B with Percent Power scales. Two hands, with bare forearms, point at the screen, apparently interpreting the readings. The graphs show brainwave frequency bands on a dark background.