Skip to content
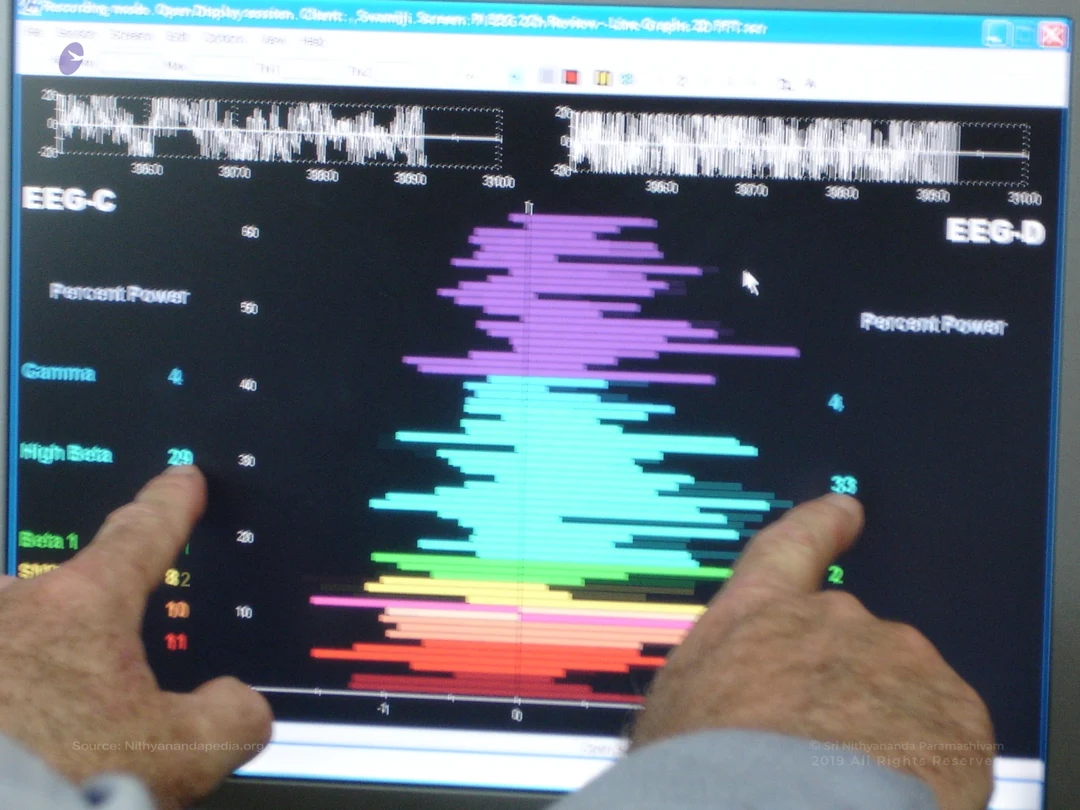
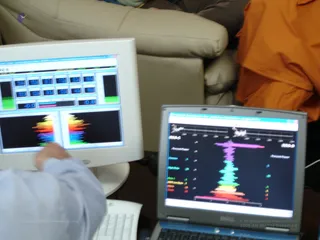
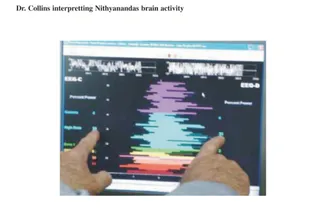
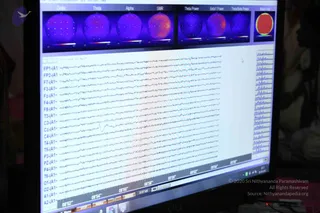
Photograph of a computer monitor displaying an EEG brainwave analysis screen in a recording software window titled Recording, mode Open Display session, Client Swamiji. Two hands with grey sleeves point at the percent power bars on the left and right, where frequency bands such as Gamma, High Beta, Beta 1 and Alpha are shown in colour-coded horizontal bars of purple, cyan, green, yellow, orange and red over a black background, with white waveform traces across the top. No people are visible apart from the two hands.
Photo 17 of 26 from 14 April 2005