Skip to content
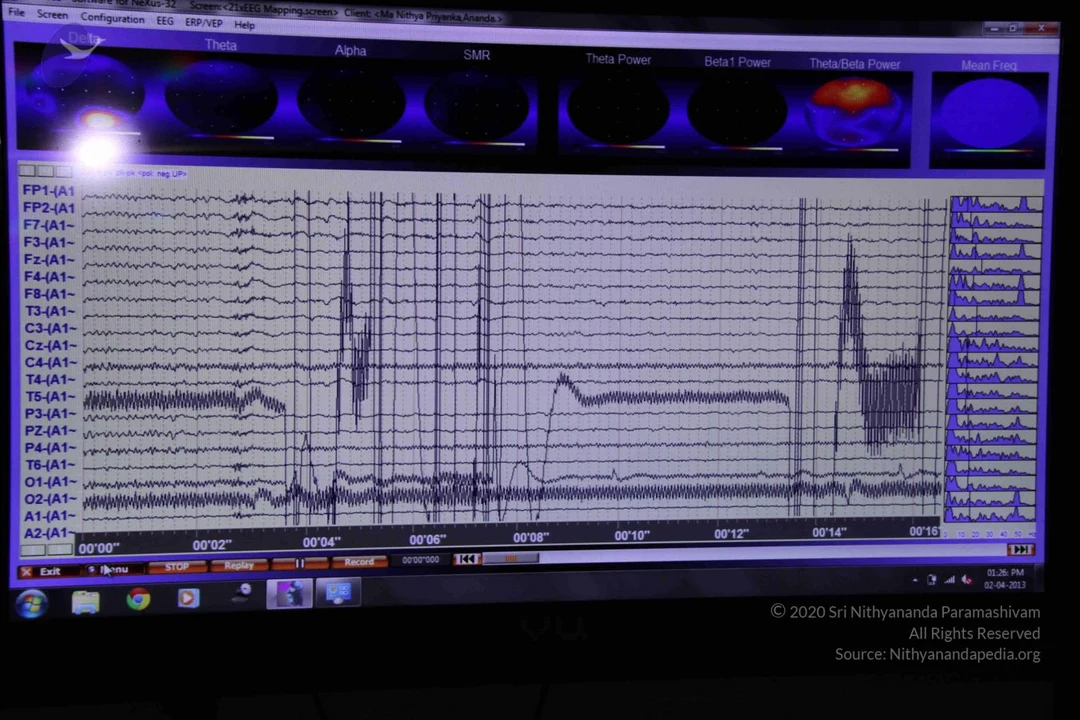
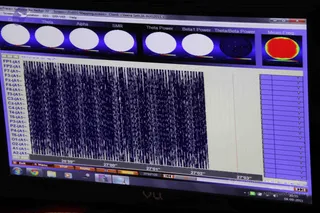
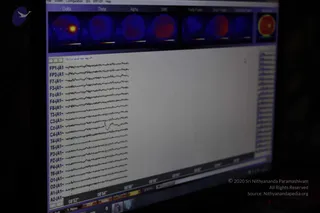
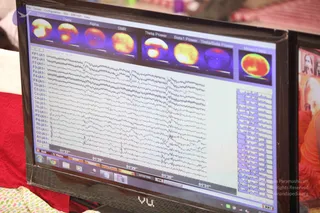
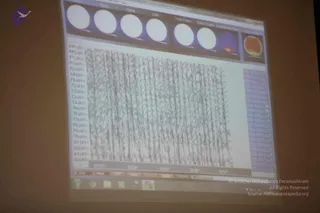
A photograph of a computer monitor displaying an EEG brain-wave recording software window. The screen shows colored topographic brain maps across the top labelled Delta, Theta, Alpha, SMR, Theta Power, Beta1 Power and Theta/Beta Power, a multi-channel waveform trace with channel labels FP1 to A2 in the middle, a time axis from 00'00'' to 00'16'', and a column of small power spectra on the right. Windows taskbar and menu buttons are visible at the bottom. No people are visible in the scene.
Photo 198 of 280 from 2 April 2013