Skip to content
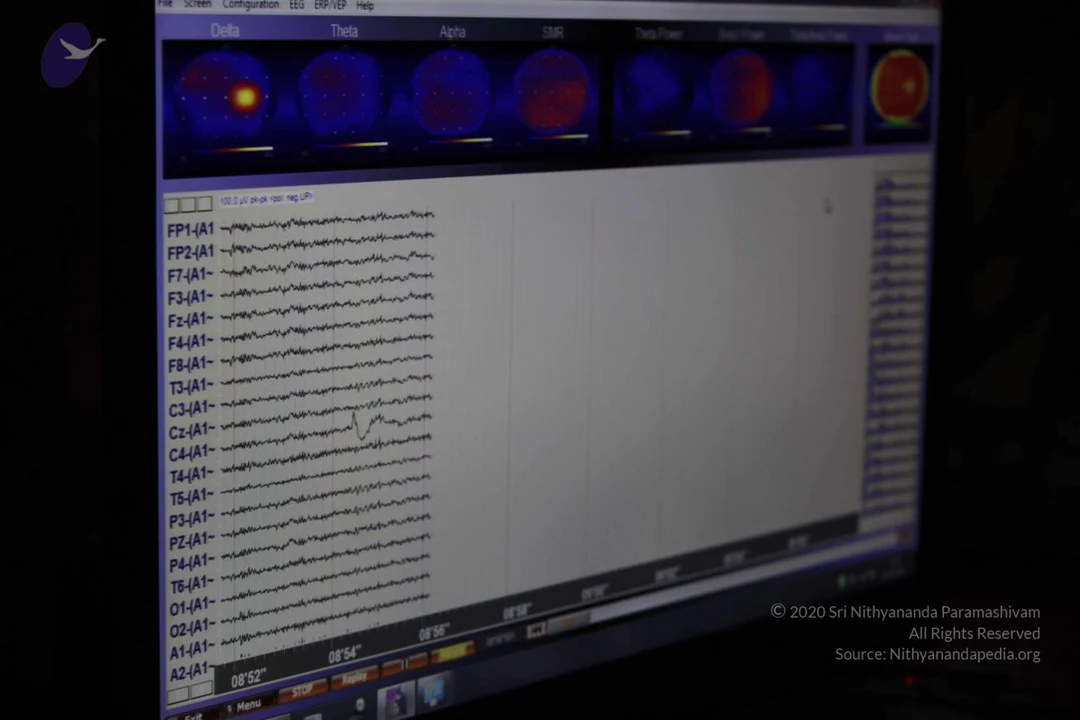
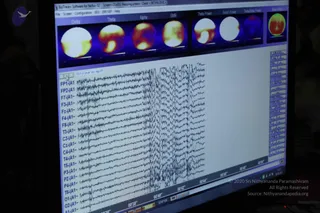
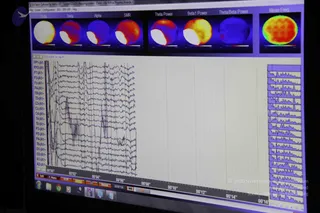
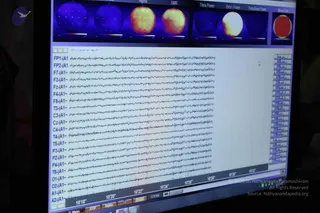
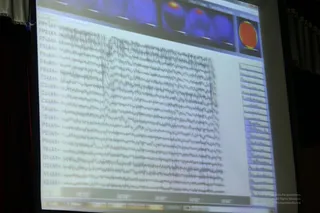
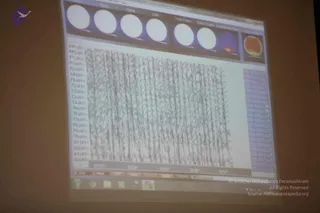
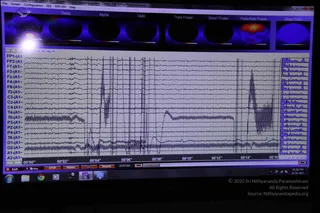
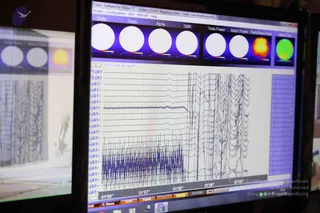
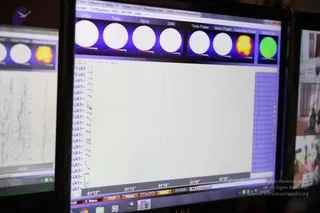
A photograph of a computer monitor displaying an EEG brain-wave recording software interface. The top row shows colour-mapped brain topography maps labelled Delta, Theta, Alpha, SMR, Theta Power, Beta Power and Gamma-type bands, with red and blue heat patterns. Below, multichannel traces for channels such as FP1-(A1), F7, Cz, O1 and A2 scroll across a white grid with a timestamp of 08:52 visible at the bottom. The room is dark, with no people visible in the scene.
Photo 383 of 721 from 9 September 2012