Skip to content
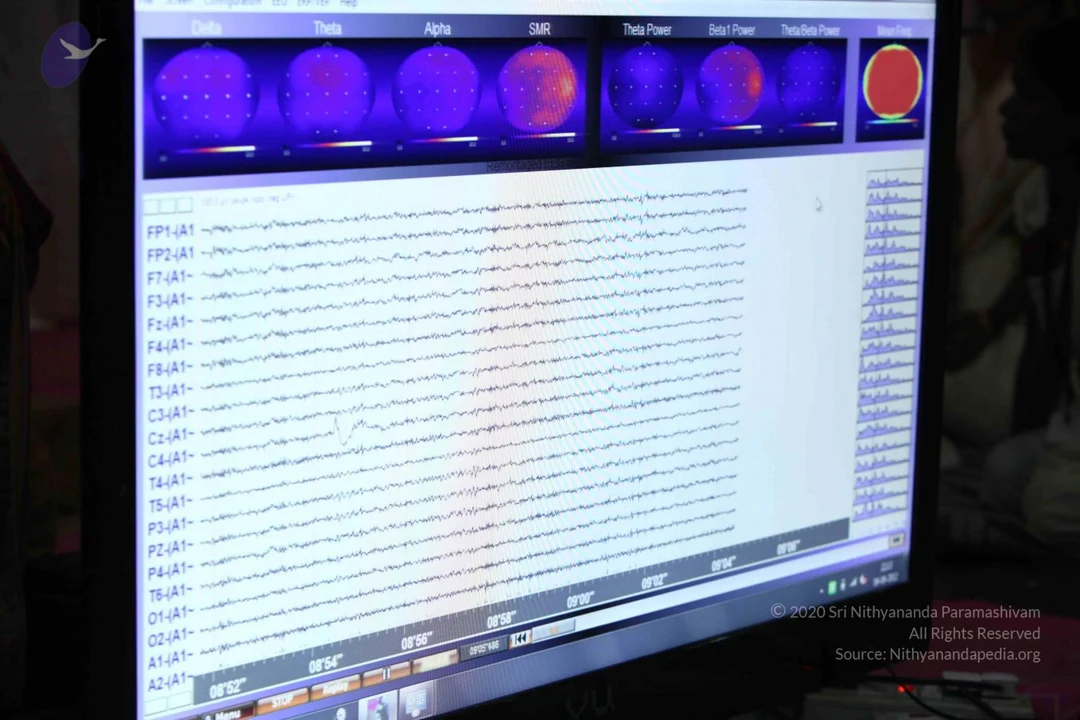
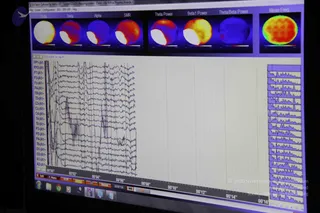
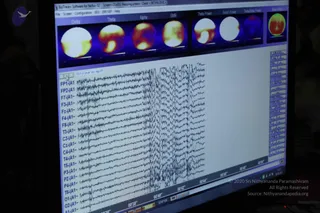
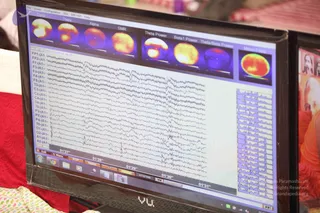
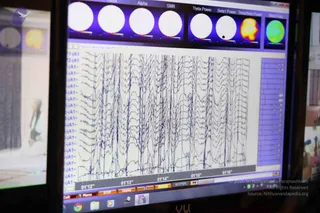
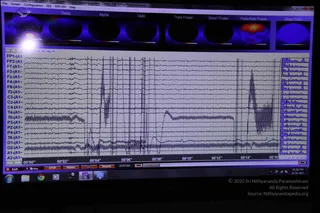
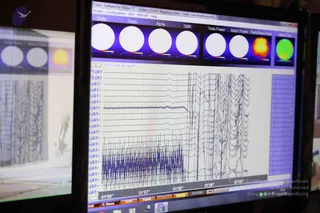
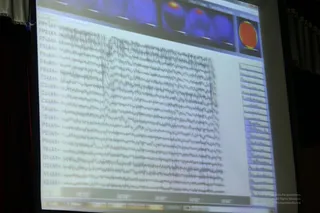
A computer monitor displays an EEG brain-wave analysis screen. The top row shows colour-coded topographic brain maps labelled Delta, Theta, Alpha and SMR, plus Theta Power, Beta1 Power and Theta/Beta Power panels and a Mean Freq. gauge, with blue, purple and red hues. Below, multiple horizontal traces are labelled FP1-A1, F7-A1, C3-A1, P3-A1, O1-A1 and similar electrode channels, with a time axis in the lower area. No people are visible; the screen shows recorded neurological readings in a dim room.
Photo 611 of 721 from 9 September 2012