Skip to content
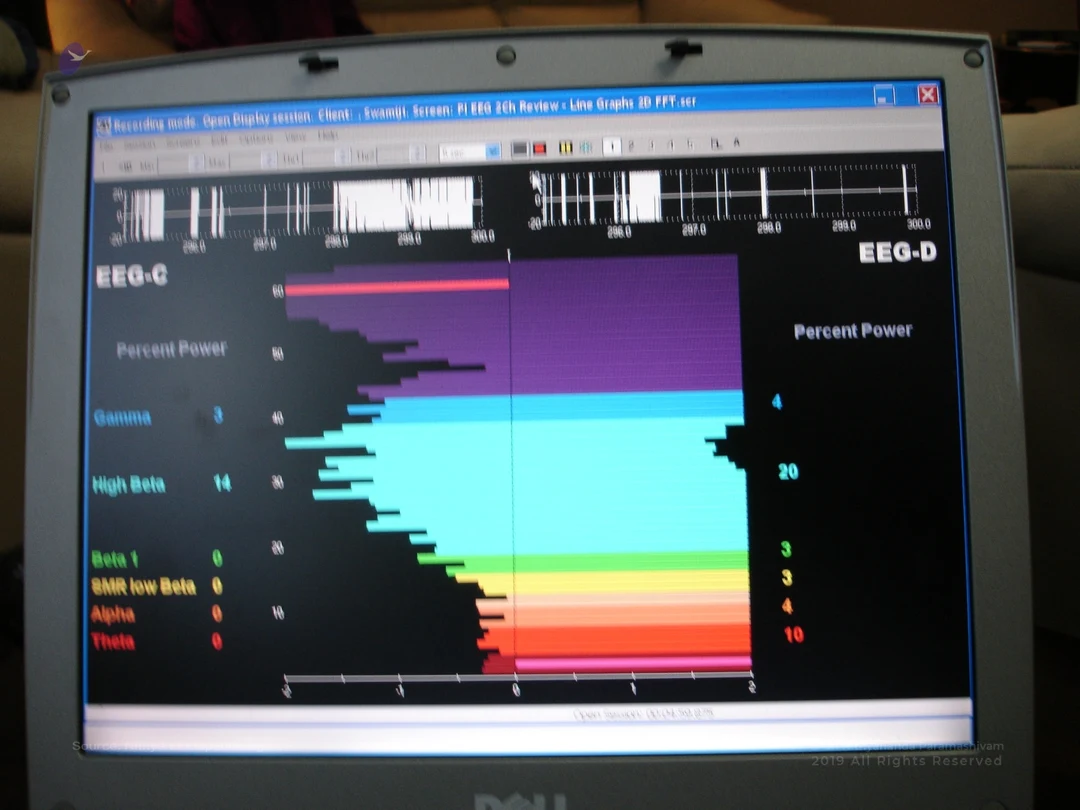
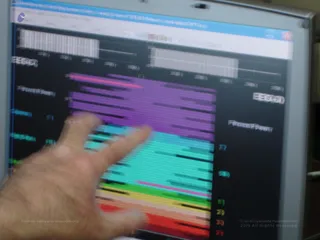
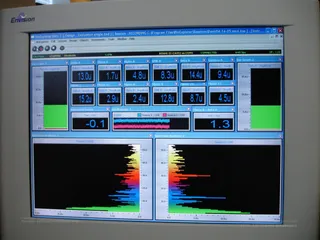
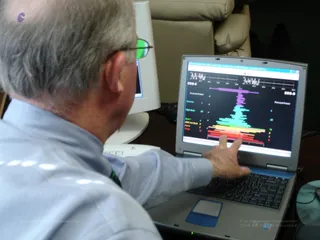
A photograph of a grey Dell computer monitor displaying an EEG recording software window titled 'Recording mode: Open Display session, Client: Swamiji, Screen: PI EEG 2Ch Review - Line Graphs 2D FFT.scr'. The screen shows colourful horizontal percent-power bar charts labelled EEG-C and EEG-D, with bands Gamma, High Beta, Beta 1, SMR low Beta, Alpha and Theta in purple, cyan, green, yellow, orange and red on a black background. Fine line-graph traces run across the top, and a dark leather seat back is visible at the edges. No people are visible.
Photo 6 of 26 from 14 April 2005