Skip to content
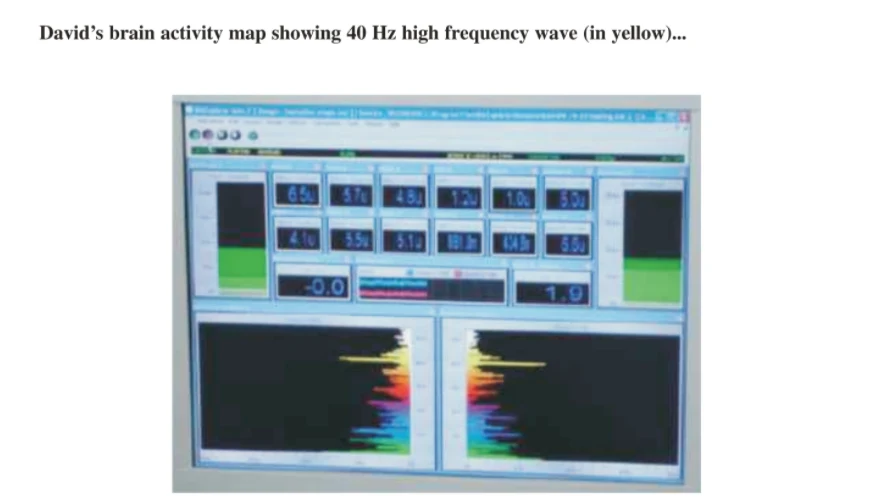
A screenshot-like photograph of a computer monitor displaying a neurofeedback brain activity software interface. Rows of blue numeric readout boxes show values such as 6.5, 5.7, 4.8, 1.2, 1.0, 5.9, 4.1, 5.5, 5.1, 18.8, 14.8 and 5.8, with -0.0 and 1.9 in larger boxes. Two black panels at the bottom show rainbow-coloured frequency spectrum graphs with a yellow horizontal line near the top, and green vertical bar gauges sit at the sides. No people are visible; the image shows only the equipment screen.