Skip to content
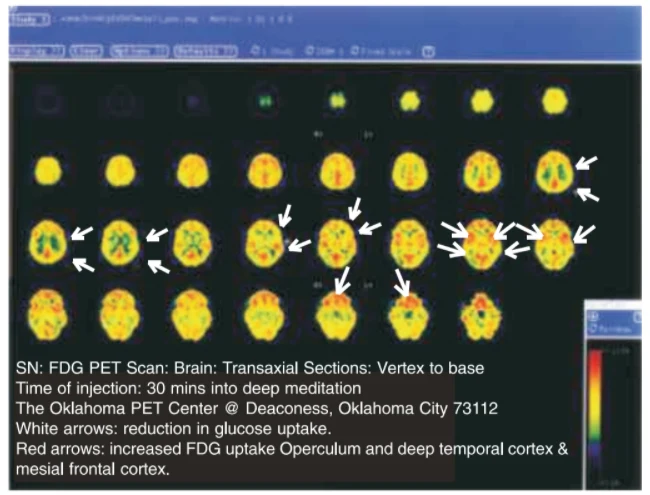
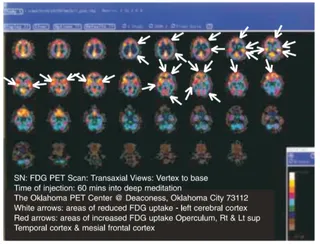
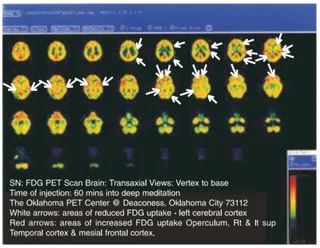
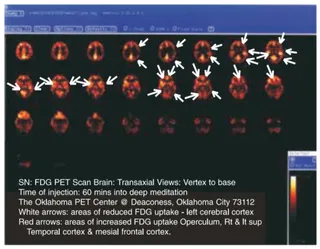
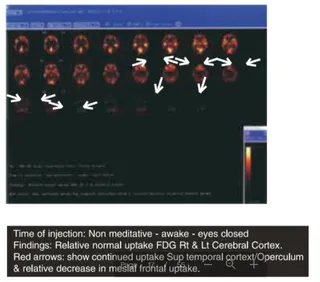
A screenshot-style scientific figure showing a grid of colourful FDG PET brain scan slices arranged in rows on a dark background, with a colour intensity scale bar at lower right. White arrows point to regions of reduced glucose uptake and red arrows to areas of increased uptake, marked against the yellow, green and red brain images. A white caption block at lower left describes the transaxial sections and the scan timing. No people are visible; the image shows only brain scans and annotations.
Photo 3 of 6 from 10 March 2004