Skip to content
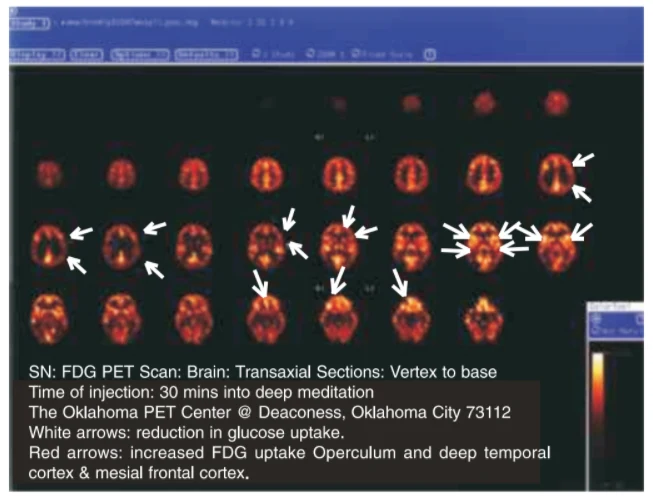
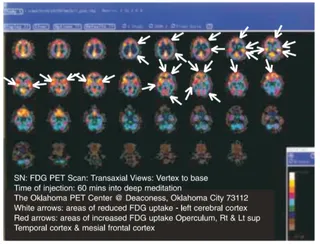
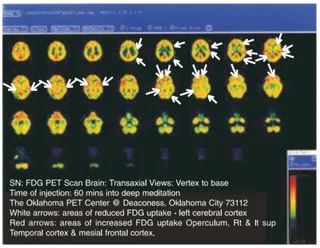
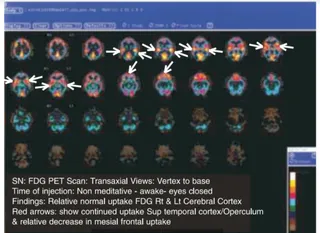
A screenshot of a software window displaying a grid of brain PET scan slices in false-colour orange, yellow and black, arranged from vertex to base. White and red arrows point to highlighted regions of brain activity. A caption on the lower left describes an FDG PET scan taken 30 minutes into deep meditation at the Oklahoma PET Center, with white arrows marking reduced glucose uptake and red arrows marking increased uptake in the operculum, deep temporal cortex and mesial frontal cortex. A colour intensity scale bar sits at the lower right. No people are visible.