Skip to content
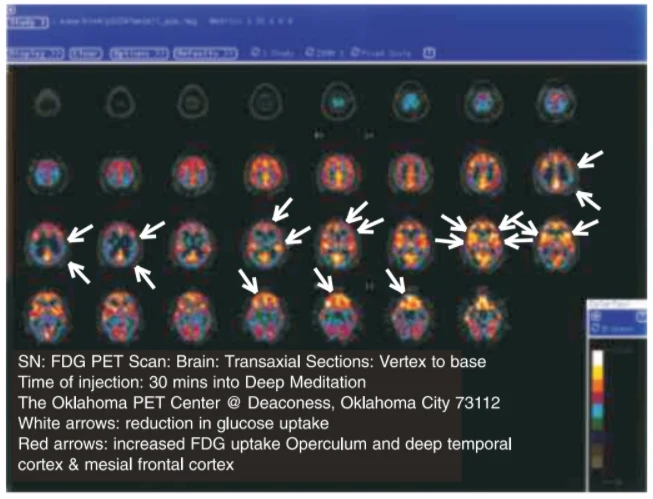
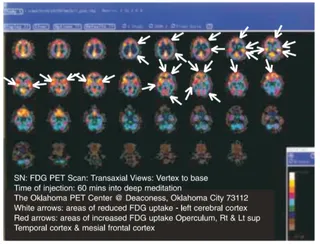
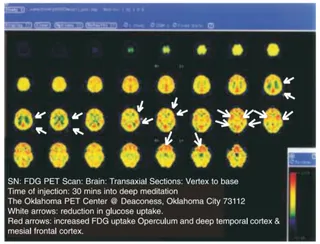
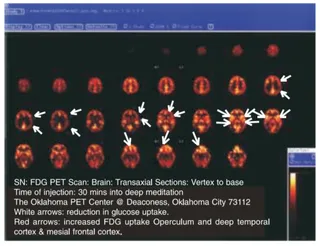
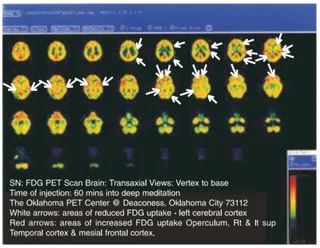
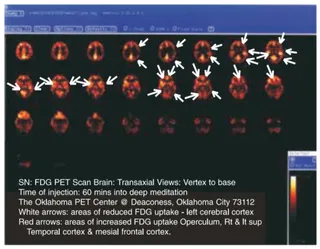
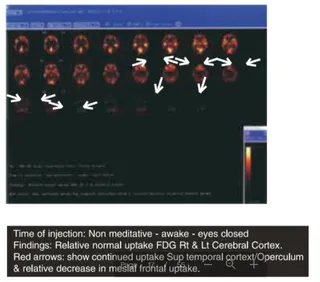
A screenshot of a PET brain scan presented as a grid of colour-coded transaxial brain slices on a dark background, with a blue software toolbar along the top and a colour intensity scale bar on the lower right. White arrows point to regions of reduced glucose uptake and red arrows mark areas of increased FDG uptake in the operculum, deep temporal cortex and mesial frontal cortex. A caption at the bottom describes the FDG PET scan of the brain, taken 30 minutes into deep meditation at the Oklahoma PET Center in Oklahoma City. No physical people are visible, and no person is shown in the scan, so no a person candidate appears.