Skip to content
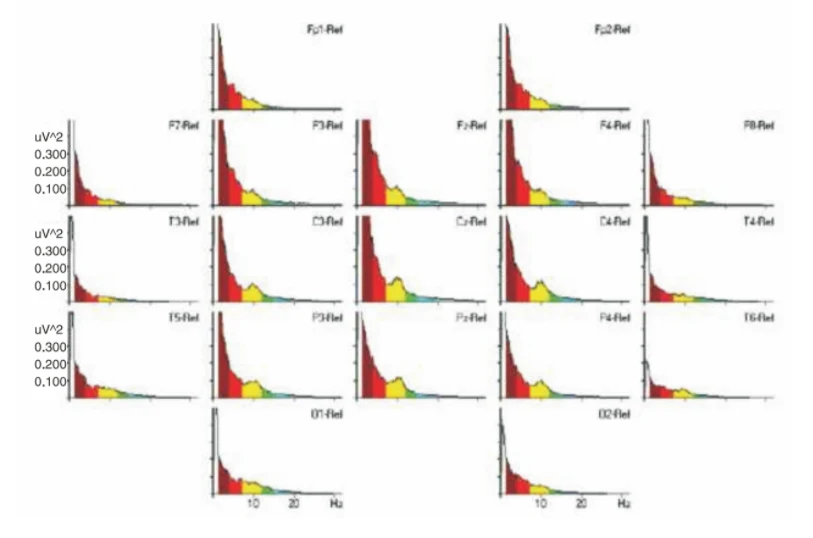
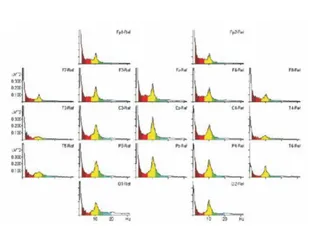
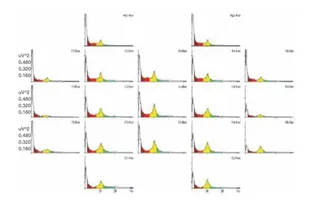
A scientific graphic showing a grid of EEG power-frequency spectra, one small chart per electrode channel, arranged in the layout of a 19-channel 10-20 montage. Each chart plots power in uV^2 against frequency in Hz, with colored bands for delta (burgundy), theta (red), alpha (yellow), and smaller beta-range areas in green and blue. The spectra are dominated by the low-frequency delta and theta peaks, with a visible alpha hump around 8-12 Hz most prominent in the central and parietal channels. Labels such as Fp1-Ref, F3-Ref, Cz-Ref and O2-Ref sit beside each plot. No people appear in the image.