Skip to content
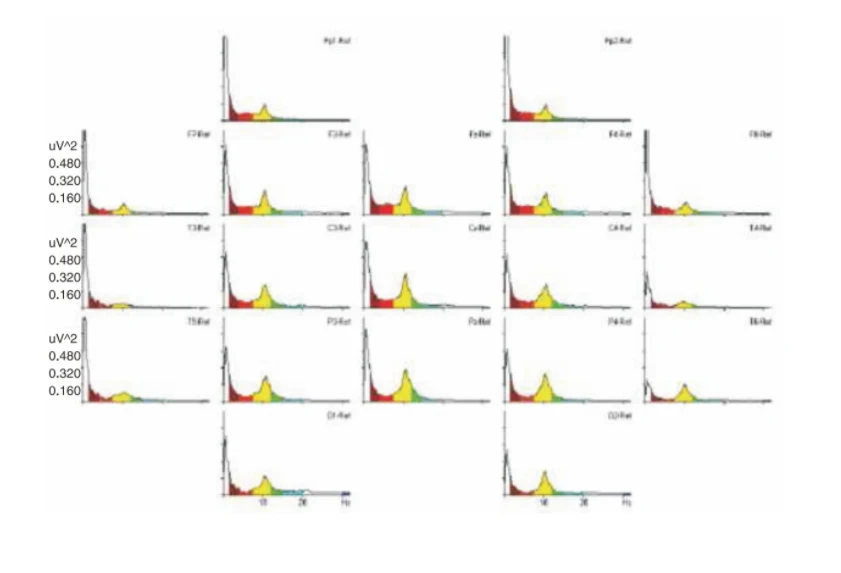
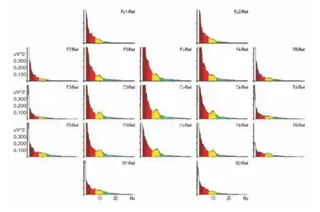
A scientific graphic showing a grid of EEG power-frequency spectra plots arranged in a head-map layout, labelled with electrode positions such as Fp1, Fp2, F7, F3, Fz, F4, F8, T3, C3, Cz, C4, T4, T5, P3, Pz, P4, T6, O1 and O2. Each small plot has a frequency axis in Hz and a power axis in uV^2 with a yellow-highlighted alpha peak near 10 Hz, a red low-frequency region and a small green band. The figure is a data chart with no people, documenting a baseline eyes-open brainwave recording.