Skip to content
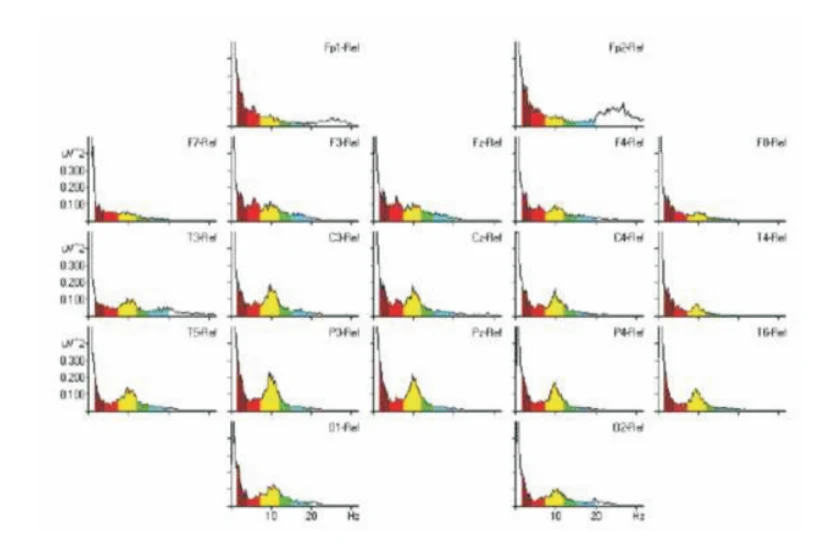
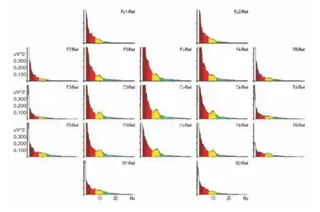
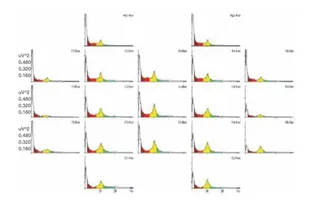
A scientific graphic showing a grid of EEG power-frequency spectra plots arranged in a head-shaped layout, labelled with electrode positions such as Fp1-Rel, Fp2-Rel, F7-Rel, F3-Rel, Fz-Rel, F4-Rel, F8-Rel, T3-Rel, C3-Rel, Cz-Rel, C4-Rel, T4-Rel, T5-Rel, P3-Rel, Pz-Rel, P4-Rel, T6-Rel, O1-Rel and O2-Rel. Each small plot has a multicoloured filled curve with red, yellow, green and blue bands along a frequency axis marked 10 and 20 Hz and a microvolt-squared amplitude axis. Most plots peak in the yellow alpha band near 10 Hz, while the Fp2 plot shows a broad high-frequency hump around 20-30 Hz. No people are shown.