Skip to content
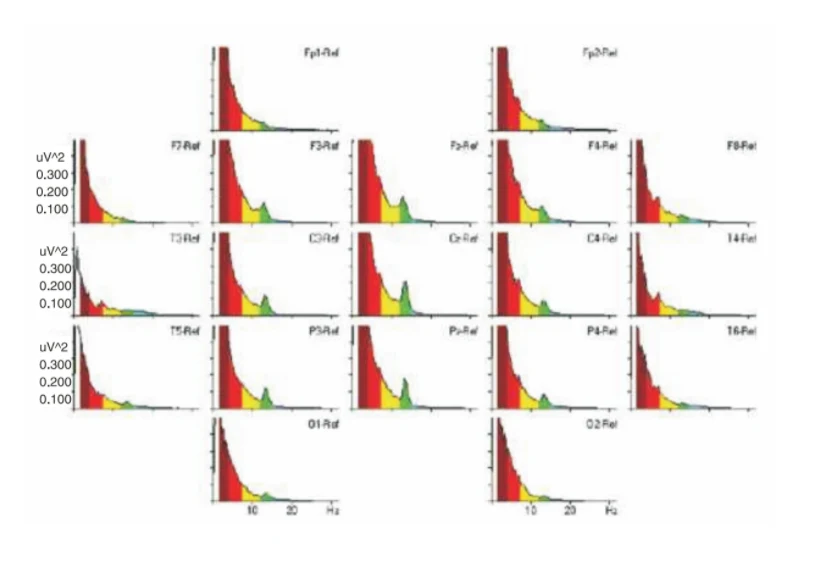
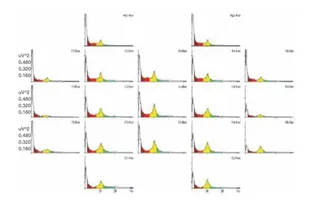
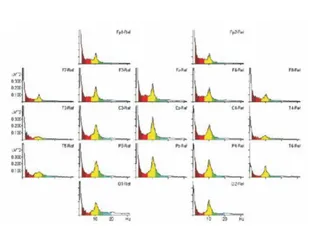
A scientific graphic showing a grid of EEG power spectrum plots arranged by electrode position on a head layout, with labels Fp1-Ref, Fp2-Ref, F3-Ref, F4-Ref, F7-Ref, F8-Ref, C3-Ref, Cz-Ref, C4-Ref, T3-Ref, T4-Ref, P3-Ref, Pz-Ref, P4-Ref, T5-Ref, T6-Ref, O1-Ref and O2-Ref. Each small plot shows power in uV^2 against frequency in Hz, with filled bands colored red (delta), yellow (theta), green (alpha/SMR) and blue. Peaks in the green band are most visible near the central electrodes. No people are shown; the image illustrates brainwave data from a deep samadhi study.