Skip to content
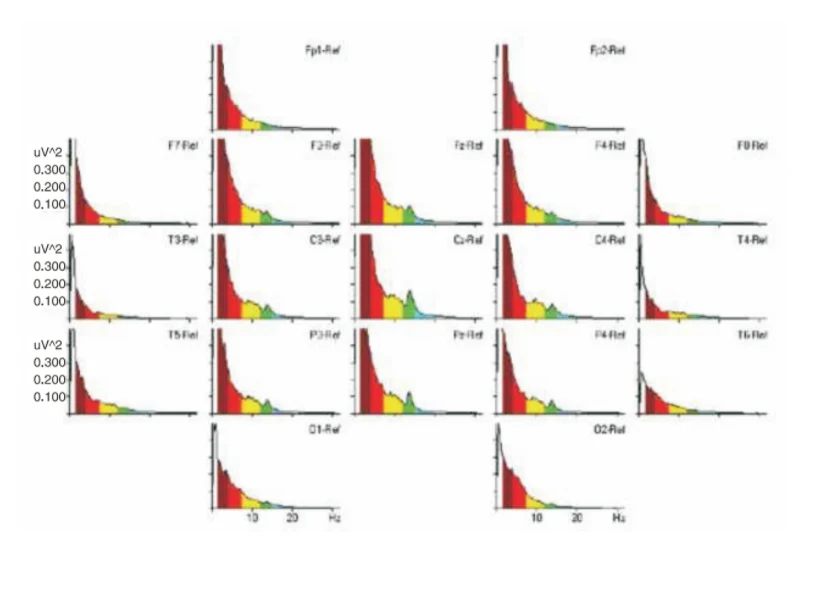
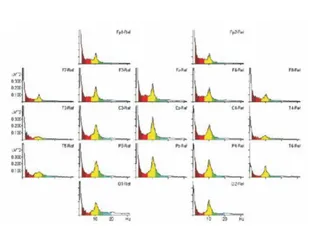
A scientific graphic showing a grid of colored EEG power spectrum plots, one per electrode site, labelled Fp1-Ref, Fp2-Ref, F7-Ref, F3-Ref, Fz-Ref, F4-Ref, F8-Ref, T3-Ref, C3-Ref, Cz-Ref, C4-Ref, T4-Ref, T5-Ref, P3-Ref, Pz-Ref, P4-Ref, T6-Ref, O1-Ref and O2-Ref. Each plot shows power in uV^2 on the vertical axis against frequency in Hz on the horizontal axis, with red, yellow, green and light blue frequency bands shaded under the curves. Green peaks appear near 12-15 Hz at central and parietal sites. No people are visible; the image is a research chart associated with a meditation EEG baseline study.