Skip to content
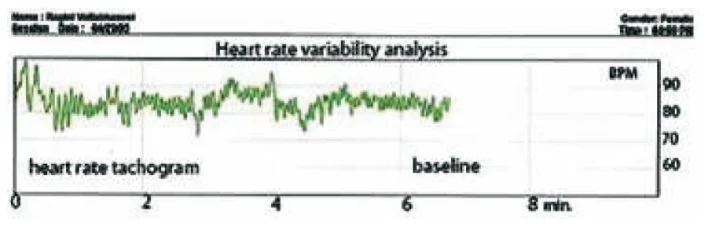
Scanned chart titled "Heart rate variability analysis" showing a green heart rate tachogram plotted against BPM on the right axis (roughly 60 to 90) and minutes on the bottom axis (0 to 8). The trace is labelled "baseline" over its later segment and "heart rate tachogram" on the left. Above the chart is a small header block with name and session date fields and a time field, with the entries mostly illegible. The page is a printed graphic from a research article with no people visible.