Skip to content
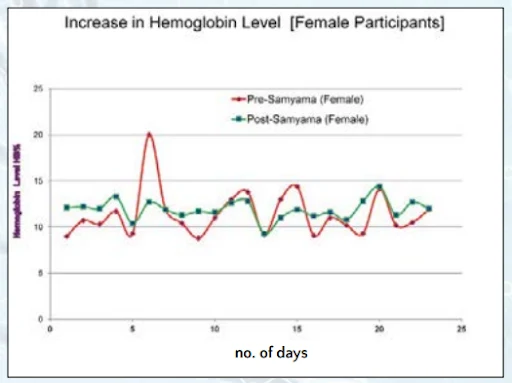
A line graph titled "Increase in Hemoglobin Level [Female Participants]" plots hemoglobin level (g/dL) against number of days from 0 to 25. Two jagged lines compare a red Pre-Samyama (Female) series, which spikes sharply near day 6, with a green Post-Samyama (Female) series that stays flatter and more consistent. Both curves hover roughly between 9 and 15, with the y-axis labelled Hemoglobin Level HB/dL and the x-axis labelled no. of days. The graph has a white background with a light blue border and no people.
Photo 236 of 243 from 10 October 2012