Skip to content
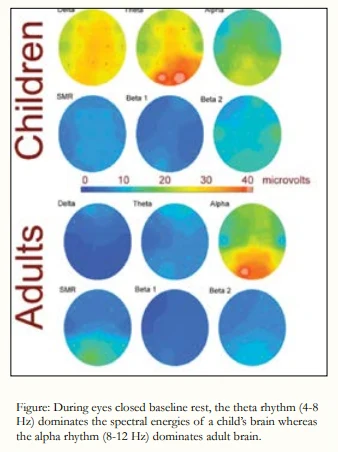
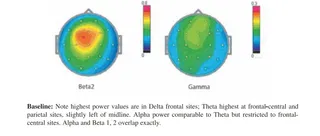
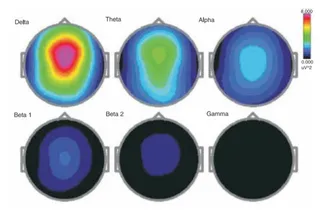
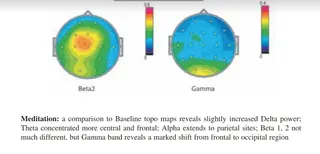
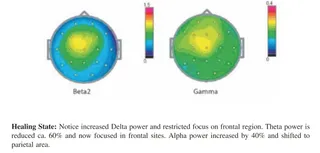
A scientific figure comparing EEG brain maps of children and adults during eyes-closed rest. Two rows of colour-scaled topographic brain plots are labelled Children (top) and Adults (bottom), with frequency bands Delta, Theta, Alpha, SMR, Beta 1 and Beta 2 across the columns. A colour bar runs from 0 to 40 microvolts, blue for low to red for high. The caption explains that the theta rhythm (4-8 Hz) dominates a child's brain while the alpha rhythm (8-12 Hz) dominates an adult brain. No people are shown.
Photo 288 of 290 from 12 April 2013