Skip to content
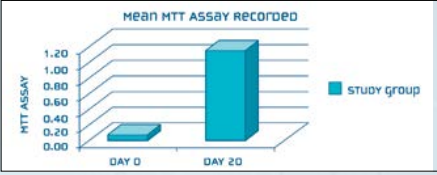
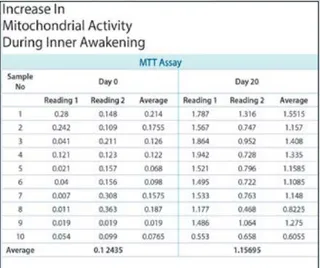
A scanned page of a laboratory protocol and statistics text, with a 3D bar chart in the middle. The chart is titled "Mean MTT Assay Recorded" and shows two blue bars labelled DAY 0 and DAY 20 on the horizontal axis; the vertical axis is labelled MTT ASSAY, scaled 0.00 to 1.20. The bar for Day 0 is very short and the Day 20 bar is tall, with a legend reading "study group". The surrounding text lists procedural steps for an MTT cell viability assay, references, and a null and alternate hypothesis. No people are present.