Skip to content
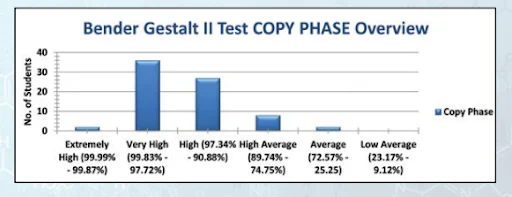
A bar chart titled "Bender Gestalt II Test COPY PHASE Overview" on a light background with blue-grey patterned edges. The vertical axis is labelled "No. of Students" and runs from 0 to 40. Six categories sit along the horizontal axis, with a single blue bar per category labelled "Copy Phase" in the legend. The tallest bar, for Very High, reaches roughly 35 students, High about 27, and High Average about 7. Extremely High and Average each show about 1 or 2, and Low Average shows none. The category labels include percentile ranges, such as Very High (99.83% - 97.72%) and Average (72.57% - 25.25%). No people or a person depiction appear.
Photo 110 of 116 from 27 April 2015