Skip to content
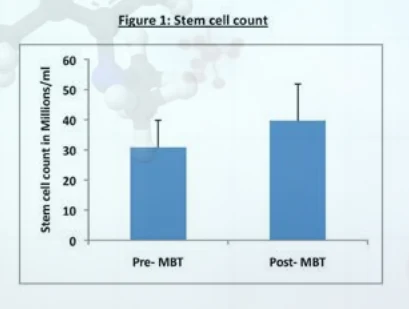
A bar chart graphic titled "Figure 1: Stem cell count" on a light background with faint molecular imagery. The vertical axis is labelled "Stem cell count in Millions/ml" and runs from 0 to 60. Two blue bars compare "Pre- MBT" at roughly 30 and "Post- MBT" at roughly 40, each with a black error bar extending above it. No people are shown.