Skip to content
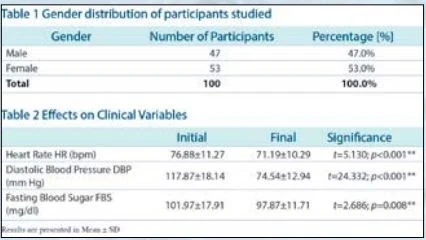
A scanned research document page with two tables. The top table is titled 'Table 1 Gender distribution of participants studied', with columns Gender, Number of Participants and Percentage [%]. Rows list Male 47 (47.0%), Female 53 (53.0%) and Total 100 (100.0%). Below it, 'Table 2 Effects on Clinical Variables' compares Initial and Final values with Significance for Heart Rate HR (bpm) 76.88±11.27 to 71.19±10.29, t=5.130; p<0.001; Diastolic Blood Pressure DBP (mm Hg) 117.87±18.14 to 74.54±12.94, t=24.332; p<0.001; and Fasting Blood Sugar FBS (mg/dl) 101.97±17.91 to 97.87±11.71, t=2.686; p=0.008. A footnote reads 'Results are presented in Mean ± SD'. No people are shown.