Skip to content
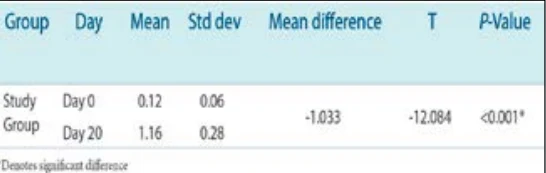
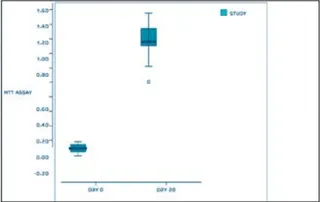
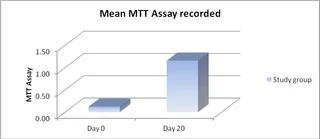
A scanned page of text presenting an MTT assay protocol, with a numbered list of steps for cell viability testing in 96-well plates, a references list, and a statistical analysis section. Below the text is a small table with columns Group, Day, Mean, Std dev, Mean difference, T and P-Value, showing a study group measured at Day 0 (mean 0.12, std dev 0.06) and Day 20 (mean 1.16, std dev 0.28), with mean difference -1.033, T -12.084 and P-Value below 0.001 marked as a significant difference. No people are present.