Skip to content
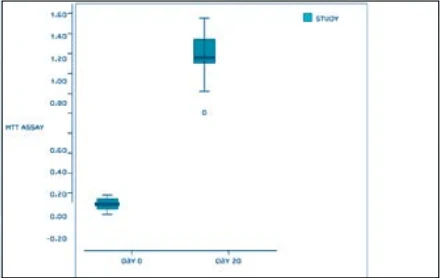
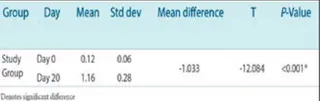
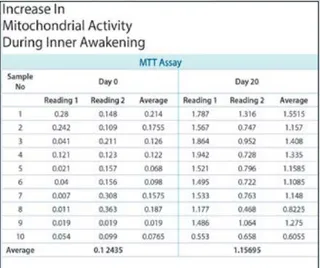
A scientific graphic titled MTT Assay - Steps, presenting numbered laboratory procedure text on a white background alongside a boxplot chart. The chart, labelled MTT ASSAY on its vertical axis with values from -0.20 to 1.60, shows two boxed groups in blue: a low cluster marked DAY 0 near 0.10 and a higher cluster marked DAY 20 near 1.20. A legend in the upper right reads STUDY. Below the chart appear reference citations and a statistical analysis section stating null and alternate hypotheses. No people are present.