Skip to content
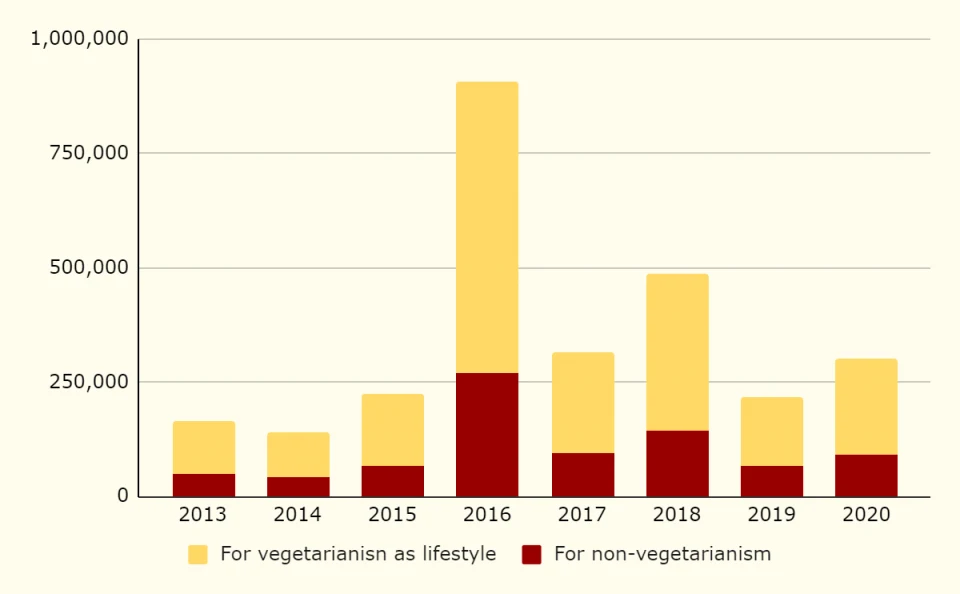
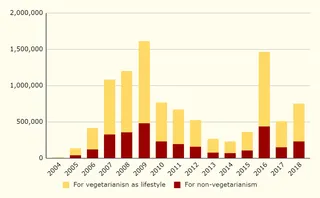
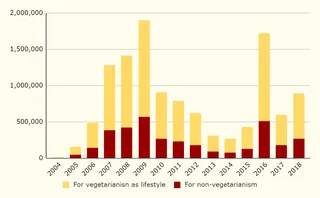
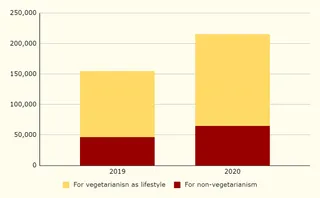
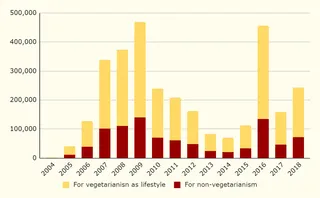
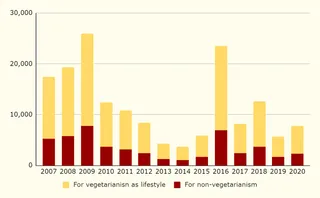
A bar chart on a pale cream background showing yearly counts from 2013 to 2020, each bar split into a yellow segment labelled for vegetarianism as lifestyle and a dark red segment labelled for non-vegetarianism. The y-axis runs from 0 to 1,000,000 in steps of 250,000. The tallest bar is 2016, reaching roughly 900,000, with about 270,000 in the red segment. Other years range roughly between 140,000 and 490,000 in total. No people or a person depiction appear in the graphic.
Photo 45 of 237 from 14 November 2020