Skip to content
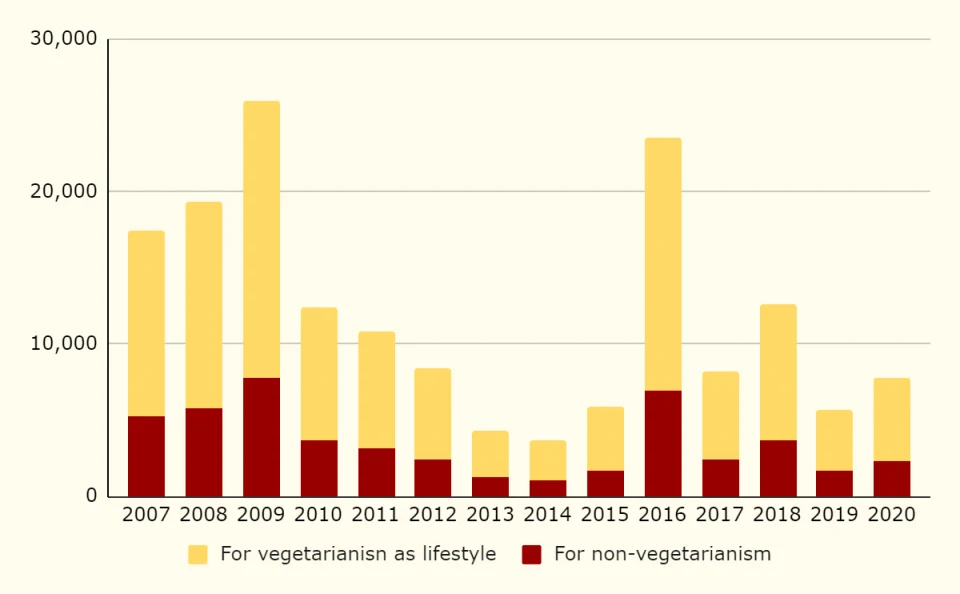
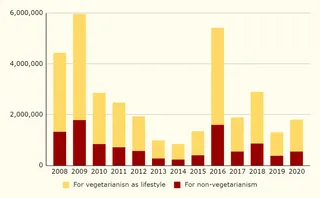
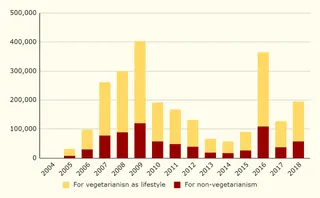
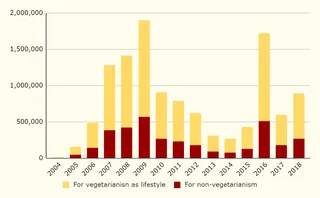
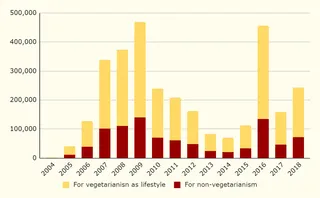
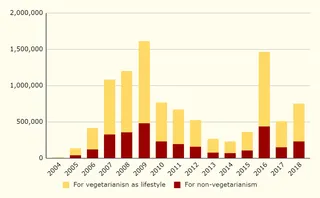
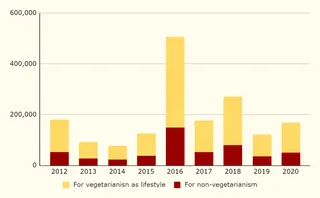
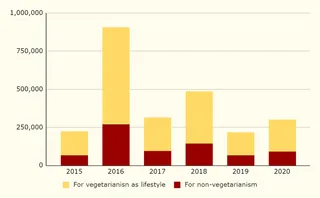
A bar chart on a cream background showing yearly counts from 2007 to 2020, with a y-axis running from 0 to 30,000. Each year has a stacked column: a dark red lower segment labelled for non-vegetarianism and a yellow upper segment labelled for vegetarianism as lifestyle. The tallest column is around 2009 and another high peak appears around 2016, while 2013 and 2014 are among the lowest. A legend sits beneath the x-axis. No people or deities are shown.
Photo 42 of 237 from 14 November 2020