Skip to content
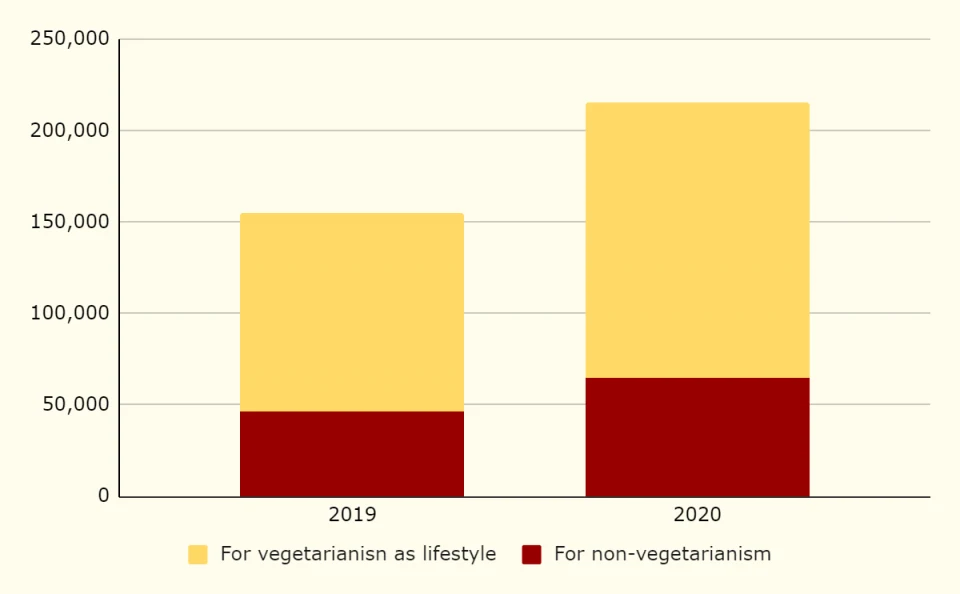
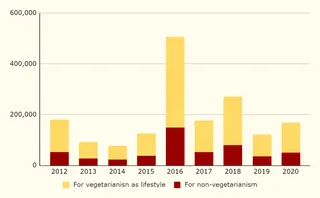
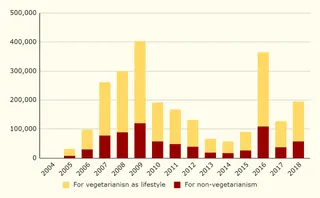
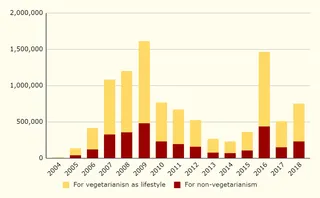
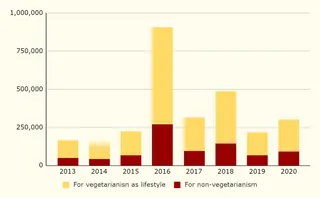
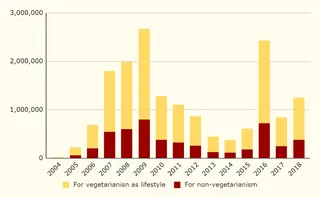
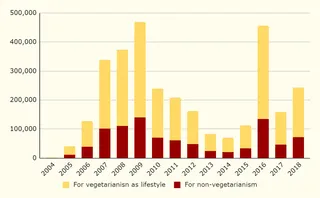
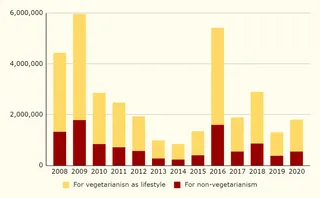
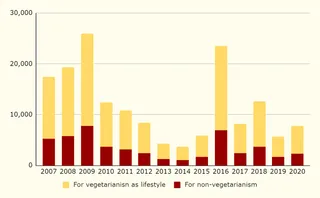
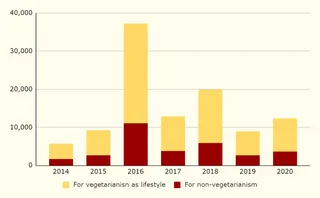
A bar chart graphic comparing two years, 2019 and 2020, on a cream background with gridlines and a y-axis from 0 to 250,000. Each year has a stacked bar: a large yellow segment for vegetarianism as a lifestyle and a smaller dark red segment for non-vegetarianism. Both segments grow from 2019 to 2020, with the total rising from roughly 155,000 to about 215,000. The chart has no physical people and no visible a person depiction.
Photo 40 of 237 from 14 November 2020