Skip to content
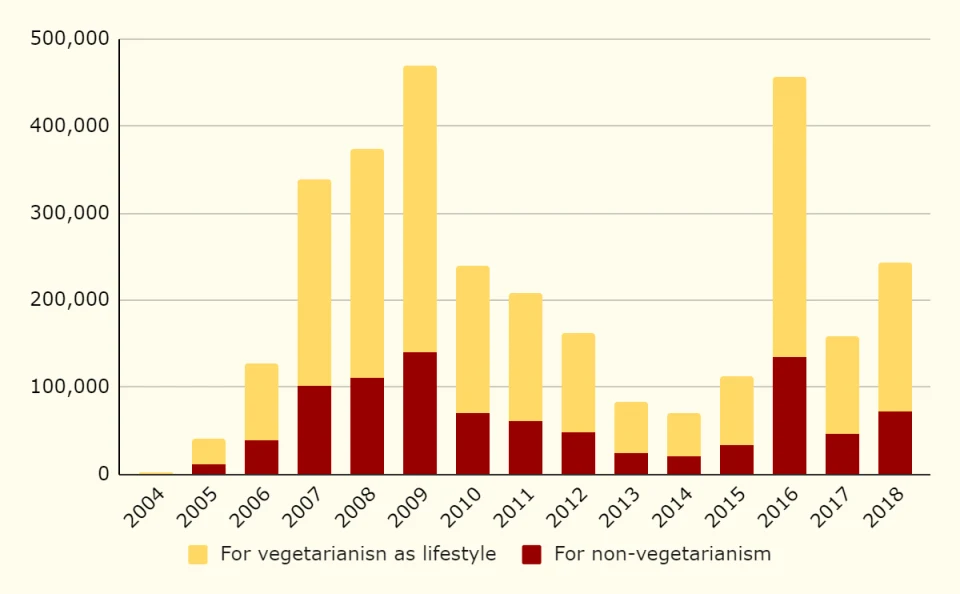
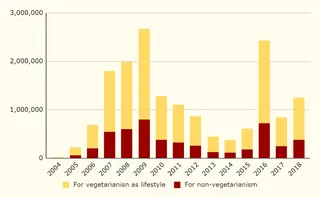
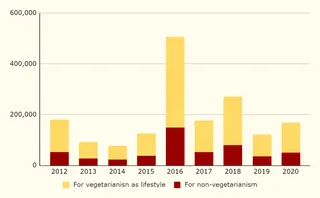
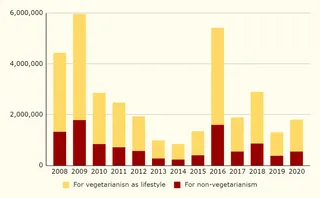
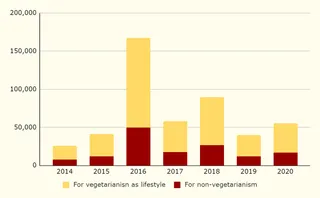
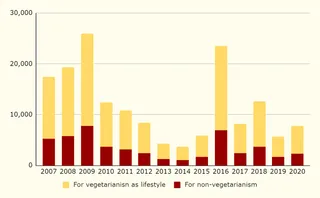
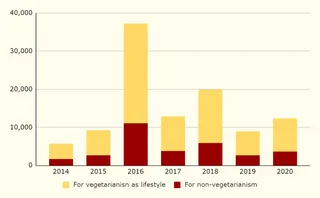
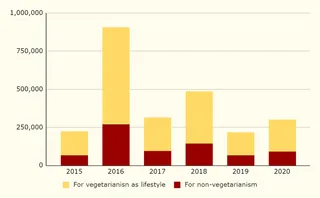
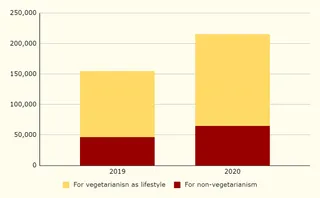
A bar chart on a cream background titled with a stacked comparison by year from 2004 to 2018, y-axis 0 to 500,000. Each bar has a dark red segment labelled For non-vegetarianism and a yellow segment labelled For vegetarianism as lifestyle. Totals rise to a peak around 2009 and again around 2016, with the non-vegetarianism share shown in dark red at the base of each column. No people, ritual or deity are shown.
Photo 26 of 237 from 14 November 2020