Skip to content
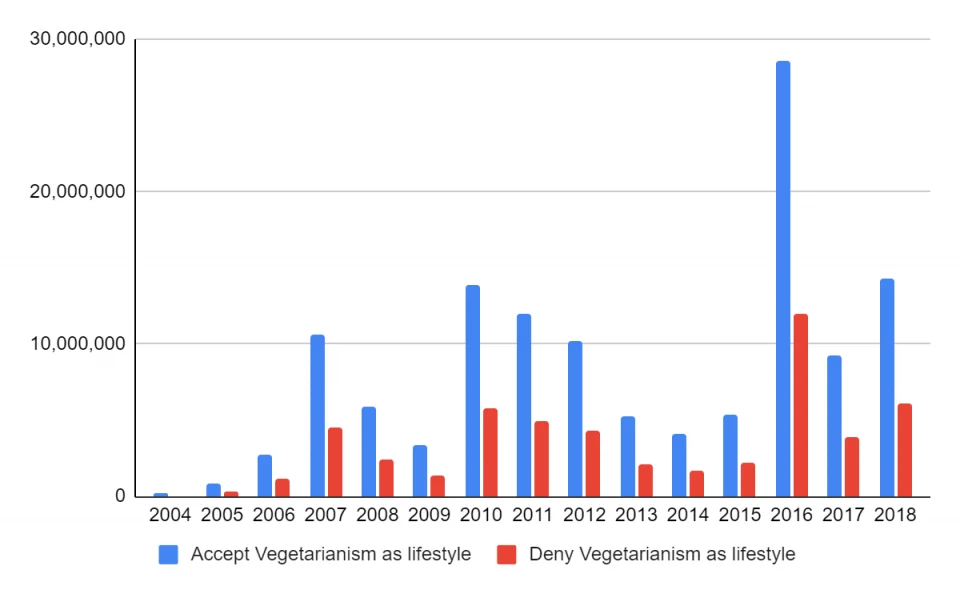
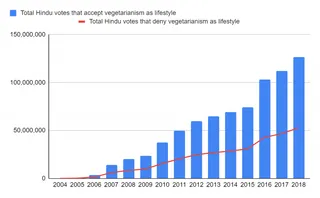
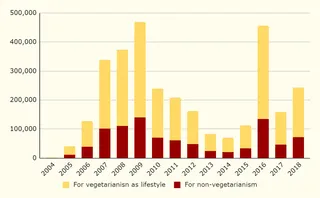
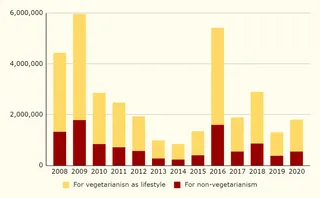
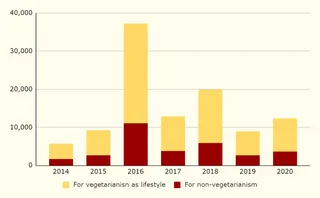
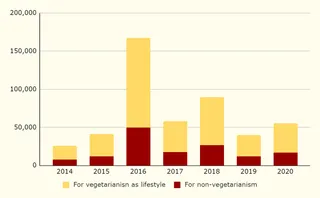
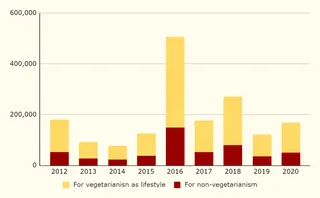
A bar chart graphic comparing two data series by year from 2004 to 2018 on a white background with light gray gridlines. Blue bars labelled Accept Vegetarianism as lifestyle are generally taller than red bars labelled Deny Vegetarianism as lifestyle. The y-axis runs from 0 to 30,000,000 in increments of 10,000,000. The tallest blue bar, around 2016, reaches nearly 30,000,000, with its red counterpart near 12,000,000. No people are shown.
Photo 19 of 237 from 14 November 2020