Skip to content
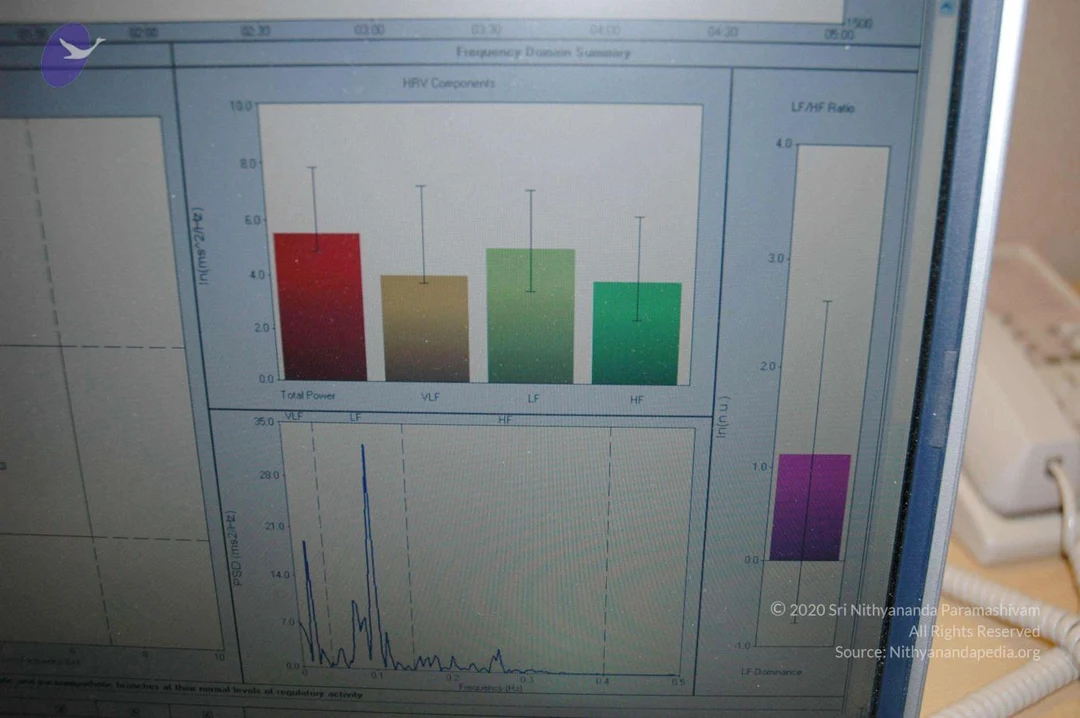
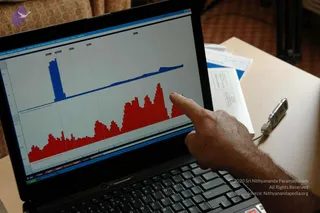
A photograph of a computer monitor displaying a heart rate variability analysis screen with a frequency domain summary. Four coloured bar charts labelled Total Power, VLF, LF and HF appear in red, olive, light green and green, with error bars. A separate purple LF/HF ratio bar sits on the right, and a blue power spectral density trace with a sharp peak runs along the bottom. A white telephone and cable are visible at the right edge. No people are visible.
Photo 140 of 188 from 26 April 2006