Skip to content
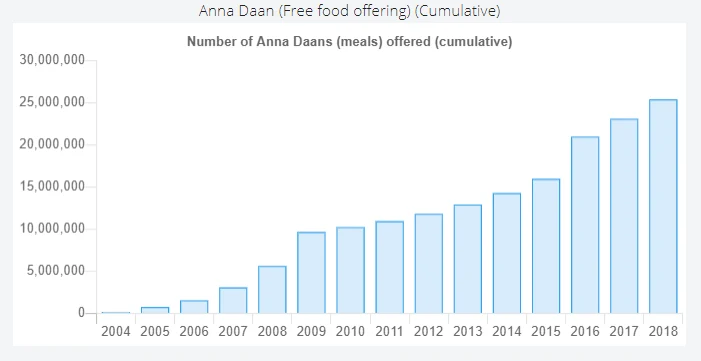
A bar chart titled "Anna Daan (Free food offering) (Cumulative)" with the subtitle "Number of Anna Daans (meals) offered (cumulative)". Light blue vertical bars with blue outlines rise year by year from 2004 to 2018 on a white background, with the y-axis scaled from 0 to 30,000,000 meals. Bars grow from near zero in 2004 to roughly 25,000,000 in 2018, with a steep climb after 2015. No people or a person depiction appear.