Skip to content
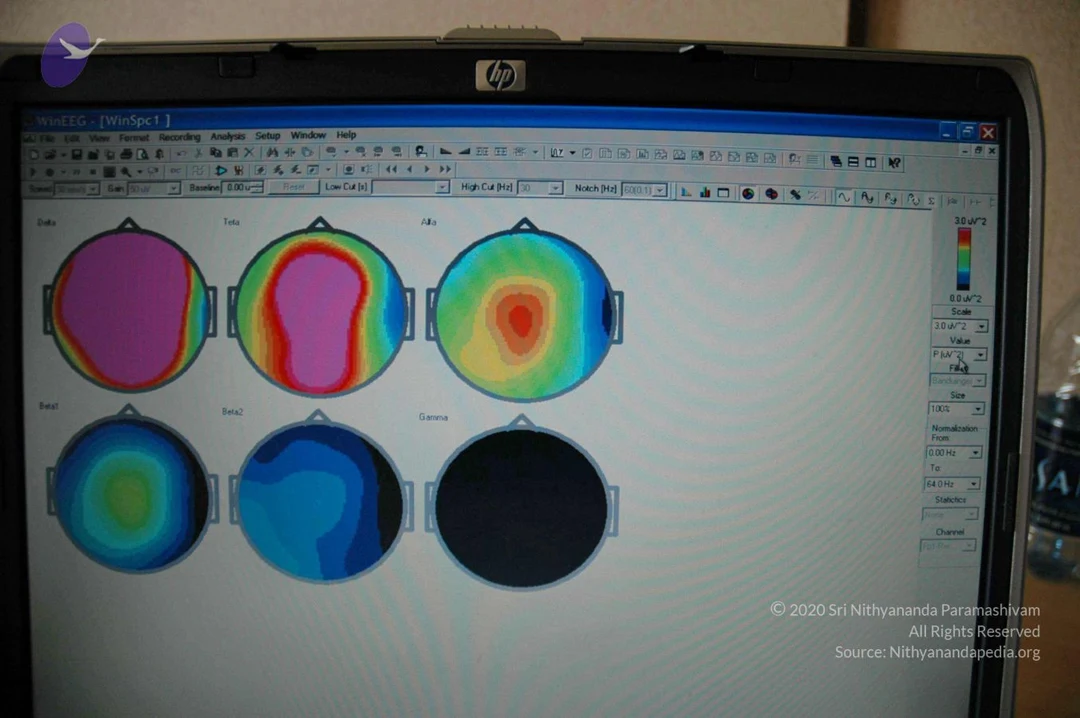
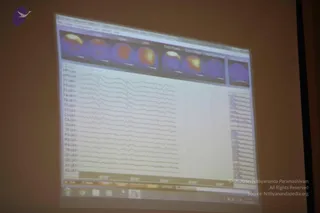
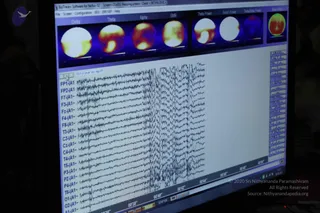
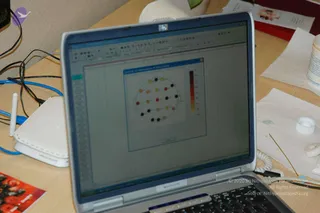
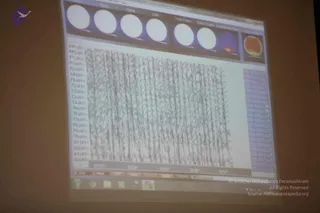
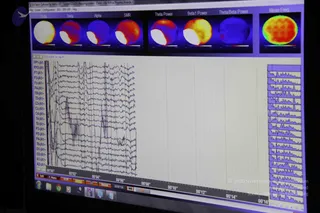
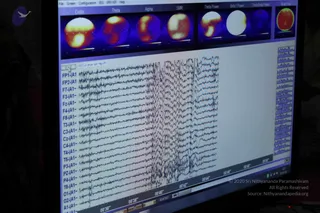
A photograph of an HP laptop screen running the WinEEG software window, showing six colour-mapped brain topography plots labelled Delta, Theta, Alpha, Beta1, Beta2 and Gamma, each shown as a head outline with a colour scale from blue through green, yellow and red to magenta. A vertical scale bar on the right displays microvolt values. No people are visible; the image shows only the computer display and a partial water bottle at the edge.
Photo 163 of 188 from 26 April 2006